

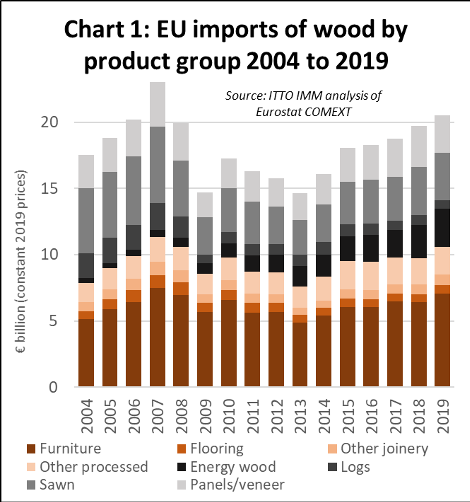
The total value of EU28 imports of wood products was 20.51 billion euro in 2019, 4% more than in 2018. This followed an increase of 5% to 19.7 billion euro in 2018. In 2019 EU28 import value was at the highest level since 2008 just before the global financial crises (Chart 1).
The rise in imports into the EU occurred despite unfavorable exchange rates and weakening economic growth during 2019, particularly in the second half of the year. According to the EU Winter 2020 Economic Forecast published on 13 February, GDP growth in the EU27 (i.e. excluding the UK) slipped to 1.5% in 2019, down from 2.1% in 2018. A further slight fall to 1.4% is projected for 2020.
The slowing economy fed through into a 4% decline in the value of the euro against the U.S. dollar last year following an 8% fall the previous year. The British pound dipped to an all-time low against the US dollar and other top currencies in the middle of 2019 as concerns mounted over Brexit, although it did rally to some extent towards the end year.
On the other hand, EU currencies remained reasonably strong relative to currencies in several key Eastern European supply countries, including Ukraine, Russia, and Turkey. These exchange rate fluctuations generally favored EU imports from Eastern Europe and acted as a drag on imports from North America and Asia.
Slow economic growth expected to continue in the EU
Looking to the future, the EU’s Winter Forecast suggests that the “external environment remains challenging” but that “continued employment creation, robust wage growth, and a supportive policy mix should help the European economy maintain a path of moderate growth”. In a positive note for the timber sector, the Forecast also suggested that “private consumption and investment, particularly in the construction sector, will continue to fuel economic growth”.
It was also noted that “the European economy could benefit from more expansionary and growth-friendly fiscal policies and enjoy positive spillovers from more benign financing conditions in some euro area Member States”.
However, the Forecast also suggests that “overall the balance of risks continues to remain tilted to the downside. The ‘Phase One’ trade deal between the US and China has helped to reduce downside risks to some extent, but the high degree of uncertainty surrounding US trade policy remains a barrier to a more widespread recovery in business sentiment.”
The outbreak of the ‘2019-nCoV’ coronavirus, with its implications for public health, economic activity and trade, especially in China, is identified in the Forecast as a new downside risk. “The baseline assumption is that the outbreak peaks in the first quarter, with relatively limited global spillovers. The longer it lasts, however, the higher the likelihood of knock-on effects on economic sentiment and global financing conditions”.
On Brexit, the Forecast notes that “While there is now clarity on trading relations between the EU and the United Kingdom during the transition period, there remains considerable uncertainty over the future partnership with the UK”.
As a forward-looking report, the EU Winter 2020 Forecast excludes the UK which ceased to be an EU member on 31stJanuary 2020 (although the UK is still subject to EU regulations until the end of the transition period on 31st December 2020).
For data on the UK, it is now necessary to look to the UK Office of National Statistics (ONS), which reports that the UK economy saw no growth in the final three months of 2019, as manufacturing contracted for the third quarter in a row and the service sector slowed around the time of the election. The ONS figures showed the UK economy grew by 1.4% in 2019, marginally higher than the 1.3% rate in 2018.
More positively, ONS data shows that the UK economy expanded 0.3% in December compared with the previous month, better than expectations. This, combined with recent sentiment indicators, suggests the UK economy has picked up since the general election on 12th December.
EU wood furniture imports rise 10% in 2019
Considering individual products (Chart 2), the value of EU imports of wood furniture increased by 10% to 7.07 billion euro in 2019 after a 1% fall in 2018. After flatlining in 2018, imports from China, the EU’s largest external furniture supplier, increased throughout 2019. Imports from Turkey, the second largest external supplier, also made some gains, but not as large as those made by several tropical suppliers including Indonesia, Vietnam, Malaysia and India. Furniture imports from Bosnia were weakening throughout the year, but imports from Serbia were rising.
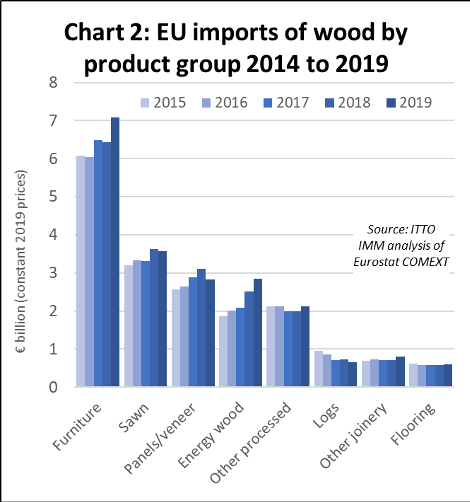
EU imports of sawn wood declined 2% to 3.57 billion euro in 2019, losing some of the gains made the previous year when imports increased 10%. After a strong first quarter, sawn wood imports slowed dramatically from April 2019 onwards. During this period, the pace of sawn wood imports fell rapidly from all four of the leading suppliers, Russia, Belarus, Ukraine, and the United States. Of tropical sawn wood suppliers, imports from Cameroon and Brazil increased, partly offset by a continuing fall in imports from Malaysia.
EU imports of panels (mainly plywood) decreased 9% to 2.83 billion euro in 2019, wiping out the 8% gain made the previous year and the first fall in imports of this commodity for 6 years. Imports from Russia and Belarus, which experienced particularly dramatic growth in previous years, slowed throughout 2019. Imports from China finished the year 2019 up on the previous year but were weakening in the second half of 2019. Imports from nearly all the other main suppliers – including Brazil, Ukraine, Chile and the US – were weakening during 2019. Indonesia fared better than most, a strong rise in plywood imports from the country in the first half offsetting a slow down towards the end of the year.
The long-term rise in EU imports of energy wood continued in 2019 with annual import value rising 13% to 2.84 billion euro building on 20% growth the previous year. There was another sharp increase in EU imports of energy wood from the United States in 2019 (now dominated by pellets), to reach nearly 1.3 billion euro, with most destined for the UK. Imports of energy wood also increased sharply from Russia, to nearly 0.5 billion euro, and Belarus, mainly destined for continental EU. Imports were stable from Canada and Ukraine.
EU imports of logs declined 9% to 660 million euro in 2019, after rising 3% the previous year. The downturn was due partly to a slowdown in imports from Russia in the second half of 2019, while all EU imports of logs from Belarus ceased in 2019 after tightening of log export controls in the country.
After rising 3% in 2018, EU imports of wood flooring made another 3% gain to 610 million euro in 2019. Flooring imports from China, by far the largest external supplier accounting for around two thirds of the total, continued to rise strongly in the first half of 2019 but began to lose ground in the second half of the year, while imports from Ukraine continued to make gains throughout 2019. Imports from Switzerland, Malaysia and Indonesia were sliding throughout the year.
EU imports of ‘other’ joinery products (i.e. excluding flooring and mainly comprising doors and laminated wood for window frames and kitchen tops) increased 12% to 800 million euro in 2019, after flatlining the previous two years. There was particularly strong growth in imports of this commodity group from Indonesia, building on gains made in the previous year, while imports from China and Malaysia also made ground.
Recovery in EU imports from China
The total value of EU imports from China increased 6% from 5.34 billion euro in 2018 to 5.71 billion euro in 2019, mainly due to a partial recovery in imports of Chinese furniture, and to a lesser extent joinery products and plywood. After falling between 2015 and 2018, China’s share in total EU imports of timber products recovered from 27.1% in 2018 to 27.8% last year (Chart 3).
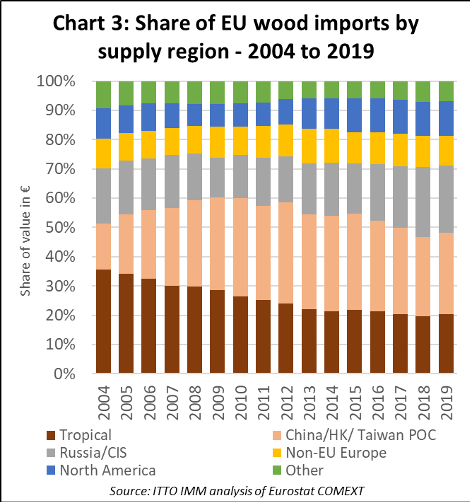
After several years of rapid growth, EU imports of wood products from CIS countries increased only 1% in 2019, rising from 4.71 billion euro in 2018 to 4.74 billion euro last year. The share of CIS countries in total EU imports declined from 23.9% in 2018 to 23.1% in 2019. The growth in imports from Russia, Ukraine and Belarus all began to slow last year. The slowing trend was apparent in imports of sawnwood, plywood and logs from the CIS region. However, EU imports of CIS energy wood and furniture products continued to rise in 2019.
EU imports from non-EU European countries remained flat, at 2.08 billion euro, in 2019 and share of imports from these countries also remained level at just over 10%. While imports from Bosnia and Herzegovina, Norway and Switzerland slowed last year, imports from Serbia and North Macedonia were rising.
EU imports from North America increased 4.3% from 2.30 billion euro in 2018 to 2.4 billion euro in 2019. The region’s share of total EU imports remained flat at 11.7% during this period. Rising imports of pellets, and to a lesser extent barrels, offset declining imports of sawnwood, furniture, and veneers from North America. The vast majority of EU imports from North America are now from the United States and only small proportion from Canada.
EU imports of tropical wood products up 7% in 2019
The total value of EU imports of tropical timber products (including direct imports and imports via third countries such as China) increased 7% to 4.16 billion euro in 2019. This follows a 2% increase in import value in 2018.
The share of tropical timber in the total value of EU wood product imports increased from 19.7% in 2018 to 20.3% in 2019, rebounding to the level of two years before. Considering the long-term trend, after falling continuously from 36% in 2006 to 22% in 2013, the share of tropical countries in EU imports stabilized in the range 20-22% during the six years between 2014 and 2019
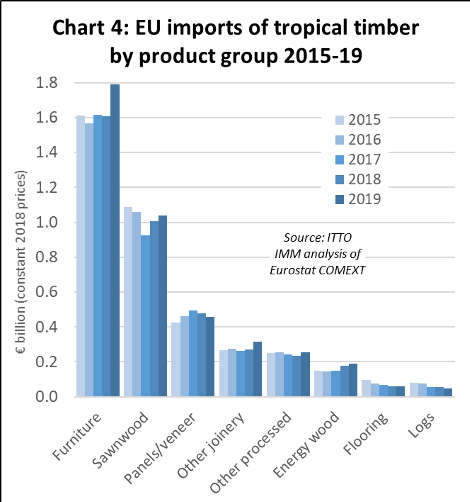
The increase in the total value of EU wood product imports from the tropics in 2019 was driven mainly by wood furniture with other smaller gains in imports of tropical sawnwood, ‘other’ (i.e. non-flooring) joinery, other processed wood products, and energy wood. These gains offset a decline in imports of tropical panels/veneers, flooring and logs (Chart 4).
In 2019, there was a 10% increase in EU imports of wood furniture from tropical countries, from 825 million euros to 904 million euros. Imports of tropical sawnwood increased 3% during the year, from 1,006 million euros to 1,040 million euros, building on the recovery of the previous year.
There was also a sharp 16% increase in EU imports of ‘other’ joinery products from tropical countries in 2019, from 273 million euros to 316 million euros, with good growth in imports of tropical doors and laminates. Imports of energy wood, mainly charcoal, also increased, by 8% from 177 million euros to 191 million euros. However, EU imports of tropical logs, panels/veneers, and flooring were either flat or declining in 2019.
The value of EU imports from the two leading tropical suppliers, Indonesia and Vietnam, increased sharply in 2019, both benefitting from a significant increase in shipments of wood furniture. Imports from Indonesia increased 10% from 825 million euros in 2018 to 904 million euros in 2019. Imports from Vietnam increased 8% from 822 million euros to 890 million euros during the same period.
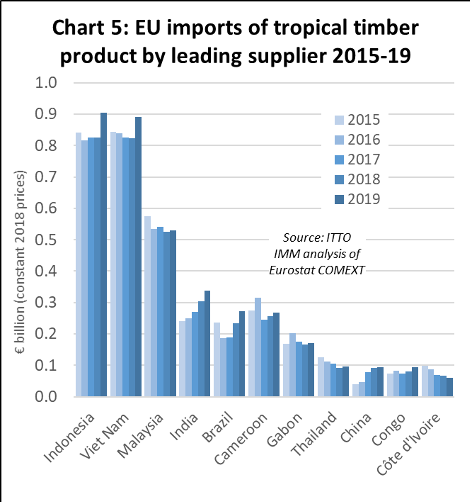
During 2019, there were also significant gains in EU imports from India (by 12% to 339 million euro, mainly furniture), Brazil (by 16% to 271 million euro, mainly hardwood sawnwood and decking), Cameroon (by 5% to 268 million euro, mainly sawnwood), and Congo (by 17% to 93 million euros, mainly sawnwood).
However, imports from Malaysia fell slightly, by 1% to 531 million euros last year, with gains made by Malaysian furniture offset by a sharp fall in EU imports of Malaysian sawnwood. EU imports from Côte d’Ivoire also continued to decline in 2019, losing another 9% to only 61 million euros.
One quarter of EU wood imports destined for the UK in 2019
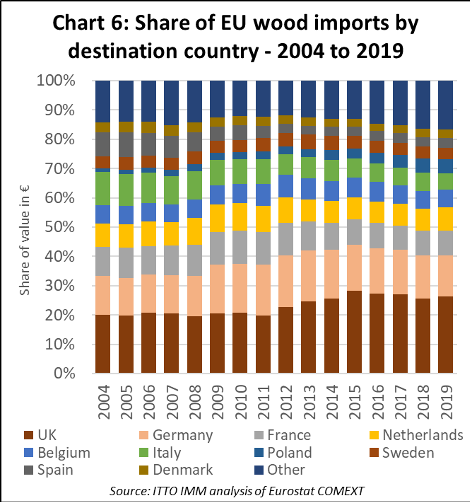
In 2019, the UK was by far the largest importer of wood products into the EU from outside the bloc, highlighting the impact of Brexit on the EU’s position in the global wood products trade. The UK’s share of total EU imports of timber products from outside the region increased from 24.9% in 2018 to 25.7% in 2019, reversing a slight downward trend of the previous year. (Chart 6).
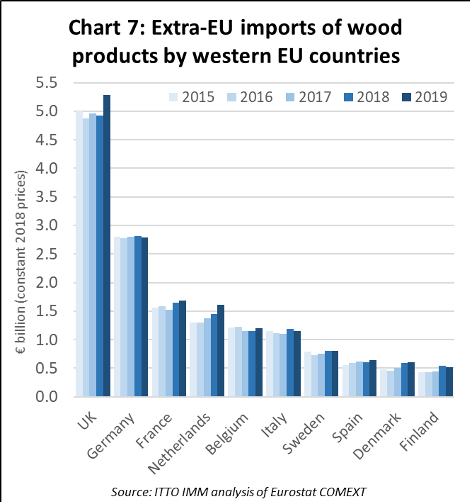
UK imports from outside the EU increased by 7% from 4.92 billion euro to 5.3 billion euro in 2019. The UK was a significant recipient of rising EU imports of wood furniture from China and Vietnam and pellets from the United States in 2019. The Netherlands was the only other Western European country to experience significant growth in imports of wood products from outside the EU last year, experiencing a significant rise in imports of wood furniture from China and Indonesia (Chart 7).
Meanwhile several Eastern EU countries continued to record quite large and consistent gains in imports from non-EU countries last year. Significant increases were recorded in Poland, Lithuania, Latvia, Slovenia, Czech Republic, Croatia, Hungary, Bulgaria, and Slovakia in 2019. However, imports into Romania and Estonia slowed in 2019 after making gains the previous year (Chart 8).
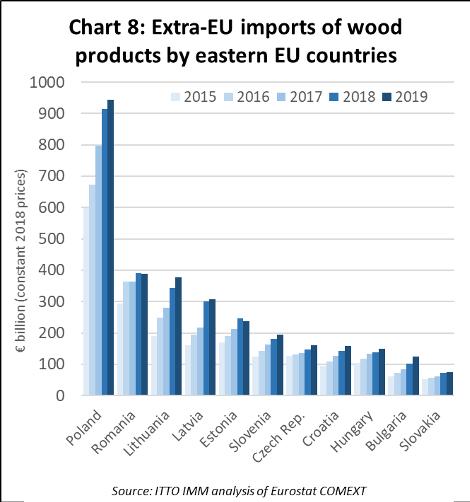
The continuing strength of Eastern European imports is a reflection both of their proximity to large external suppliers in Russia, Ukraine and Belarus, relatively higher rates of economic growth and construction sector growth in Eastern Europe, and the establishment of new wood processing and manufacturing capacity in the region.
Slow growth in EU wood product exports in 2019
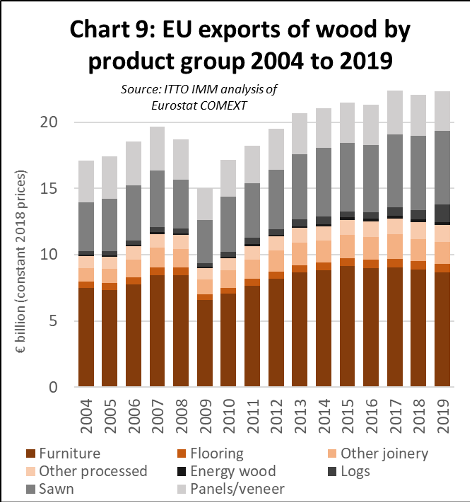
In 2019, the EU exported wood products with a total value of 22.3 billion euro, a 1% increase compared to 2018 (22.1 billion euro) but below 2017 (22.4 billion euro) when exports were at record levels (Chart 9). Although EU exports of wood furniture, sawnwood, panels, and ‘other’ joinery products, this was offset by a rise in exports of energy wood, flooring, other processed products and, particularly notable, a sharp increase in log exports, much of it comprising softwood and destined for China.
The combined effect of last year’s large rise in EU imports, balanced by a more moderate growth in EU exports, was to reduce the EU’s trade surplus in timber products with the rest of the world from 2.37 billion euro in 2018 to 1.81 billion euro last year. Longer term, the EU’s trade surplus in wood products has now fallen by 70% since 2013 (when it stood at over 6 billion euro) as growth in EU imports has outpaced exports.
PDF of this article:
Copyright ITTO 2020 – All rights reserved