

EU imports of tropical wood products rebounded in 2018 following a dip in 2017. The pace of tropical wood product imports increased in the second half of 2018 after a slow start to the year. In total, the EU imported 2.09 million metric tonnes (MT) of tropical products listed in HS Chapter 44 (excluding fuelwood, wood waste and chips) in 2018, 6% more than in 2017 (Chart 1). The total value of imports was €2.23 billion in 2018, 4.4% more than the previous year.
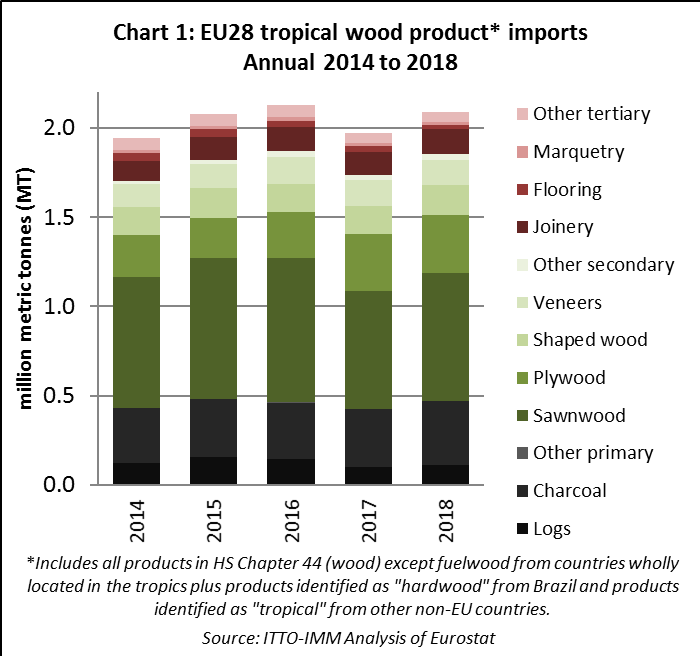
In 2018, there were gains in EU imports of tropical sawnwood, charcoal, mouldings/decking, joinery products, plywood and logs. These gains were partly offset by a decline in imports of tropical veneers, flooring, and other processed products.
8% rise in EU imports of tropical sawnwood in 2018
Despite a slow start to the year, EU imports of tropical sawnwood were 716,400 MT in 2018, 8% more than in 2017. Import value also increased, by 10% to €720 million. A significant amount of tropical sawnwood arrived into the EU from Cameroon in the second half of 2018, taking the total import from that country to 253,400 MT, 5% more than in 2017.
EU tropical sawnwood imports also increased from most other leading supply countries in 2018, including Brazil (+24% to 104,400 MT), Malaysia (+3% to 99,400 MT), Gabon (+14% to 91,200 MT), Congo (+13% to 47,400 MT), Ghana (+15% to 15,100 MT), Indonesia (+42% to 14,500 MT), DRC (+5% to 13,500 MT) and Myanmar (+72% to 9,200 MT). These gains offset declining imports from Côte d’Ivoire (-10% to 29,400 MT) and Suriname (-8% to 5,900 MT). (Chart 2).
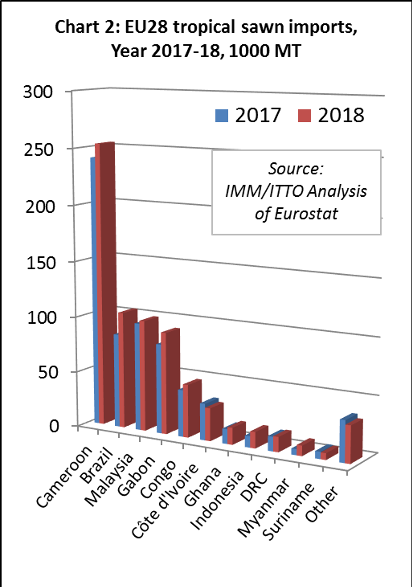
The rise in imports from Indonesia, which only allows exports of S4S lumber, may be partly due to alterations in the HS codes used to record imports from Indonesia following introduction of FLEGT licensing. The rise in EU imports of sawnwood from Indonesia is offset by a similar decline in imports of mouldings from the country.
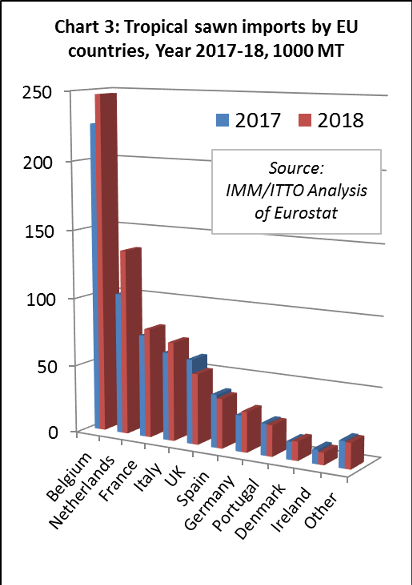
In 2018, tropical sawn hardwood imports increased 9% to 247,100 MT in Belgium, bolstered by strong growth in the second half of the year. Imports also increased in the Netherlands (+31% to 135,500 MT). In 2018, around 53% of all EU tropical sawn wood imports arrived into either Belgium or the Netherlands, up from 50% the previous year, highlighting the rising role played by importers in these two countries in distribution of tropical hardwoods to the wider EU market.
Nevertheless, during 2018 direct imports of tropical sawn wood recovered some of the ground lost in previous years in France (+7% to 79,900 MT), Italy (+12% to 72,300 MT), Germany (+12% to 29,500 MT) and Denmark (+7% to 13,900 MT). These gains offset a 16% decline to 51,800 MT in the UK, a 6% fall to 36,300 MT in Spain, a 2% decline to 22,700 MT in Portugal, and a 15% downturn to 8,900 MT in Ireland. (Chart 3).
EU imports of tropical logs rise 11% in 2018
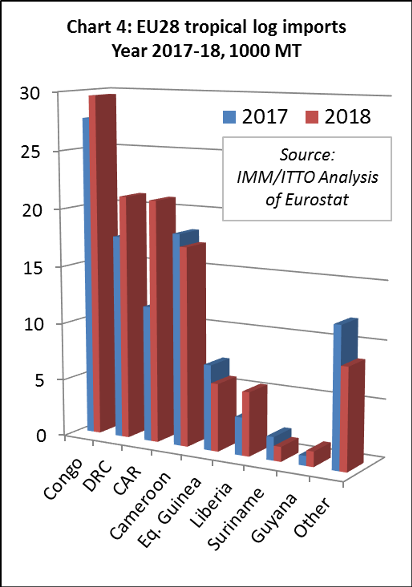
After a sharp downturn in 2017, EU imports of tropical logs recovered some lost ground in 2018 but were still at historically very low levels. Imports of 111,700 MT in 2018 were 11% greater than the previous year. The value of tropical logs imported by the EU also increased, by 5% to €55.7 million. As for sawnwood, EU imports of tropical logs picked up pace in the second half of 2018 after a slow start to the year.
EU imports of tropical logs increased from Congo, the leading supplier, rising 7% to 29,600 MT in 2018. There was also a significant increase in EU log imports from DRC (+20% to 21,100 MT), CAR (+78% to 21,000 MT), Liberia (+69% to 5,500 MT), and Guyana (+56% to 1,300 MT).
These gains offset declining imports from Angola, from over 5,000 MT in 2017 to negligible levels in 2017, Cameroon (-6% to 17,200 MT), Equatorial Guinea (-21% to 5,900 MT) and Suriname (-37% to 1,300 MT) (Chart 4).
Most of the gain in EU imports of tropical logs in 2018 was concentrated in France (+10% to 39,800 MT) and Belgium (+40% to 30,100 MT). Imports of tropical logs were very slow in Portugal in the first half of 2018 but increased in the second half of the year. In total, Portugal imported 19,400 MT of tropical logs in 2018, 2% more than the previous year. Italy’s imports also increased, by 3% to 10,400 MT in 2018.
EU tropical decking imports pick up pace in last quarter of 2018
EU imports of tropical mouldings (which includes both interior mouldings and exterior decking products) increased 9% to 170,100 MT in 2018, with the pace of trade picking up in the last quarter of the year. Import value increased 13% to €255.7 million.
A 26% rise in EU imports of mouldings from Brazil to 70,800 MT in 2018 offset a 12% decline in imports from Indonesia to 61,200 MT. As noted earlier, the latter decline may be partly due to alterations in the HS codes used to record imports from Indonesia since introduction of FLEGT licensing.
There was a sharp rise in EU imports of mouldings from several smaller suppliers of this commodity in 2018, including Malaysia (+30% to 11,600 MT), Peru (+66% to 8,900 MT), Bolivia (+94% to 5,200 MT), and Viet Nam (+112% to 1,300 MT). (Chart 5).
In 2018, imports of tropical mouldings increased 36% in France to 47,700 MT, 11% in Belgium to 28,800 MT, 12% in Italy to 7,100 MT and 11% in Denmark to 4,700 MT. These gains were offset by a 7% decline in imports in the Netherlands, to 25,400 MT, and an 8% decline in the UK, to 10,500 MT. Imports were at the same level as the previous year in Germany (36,300 MT).

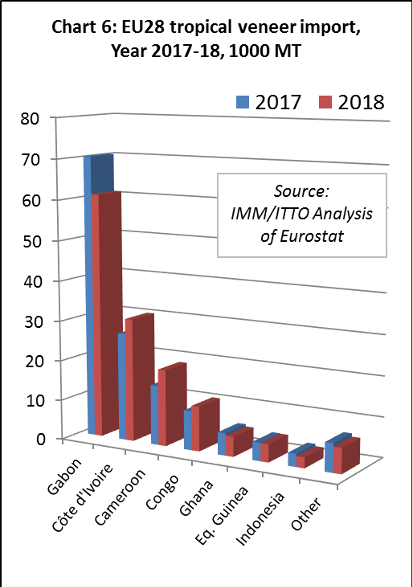
EU tropical veneer trade picks up pace in closing months of 2018
After a very slow start to the year, the pace of EU tropical veneer imports picked up dramatically in the second half of 2018, particularly from Gabon, the largest supplier. In total, EU imports of tropical veneer fell 1.3% to 140,400 MT in 2018. Import value fell 4% to €179.7 million. Imports from Gabon were down 13% by the end of 2018, at 61,100 MT, having trailed by more than 30% after the first six months when trade was severely disrupted by the financial difficulties at Rougier.
In 2018, the decline in EU veneer imports from Gabon was partly offset by rising imports from Cote d’Ivoire (+14% to 30,700 MT), Cameroon (+28% to 19,100 MT) and Congo (+ 15% to 11,100 MT). Imports fell from several smaller suppliers including Ghana (-10% to 5,000 MT), Equatorial Guinea (-2% to 4,400 MT) and Indonesia (-18% to 2,600 MT). (Chart 6).
In 2018, imports of tropical veneer in France, the largest EU market, were down 6% at 48,900 MT, and also declined 14% to 10,800 MT in Greece, and fell 13% to 5,100 MT in Germany. Imports of tropical veneer strengthened in south western Europe in the second half of 2018, finishing the year up 2.4% in Italy at 33,100 MT and up 20% at 25,200 MT in Spain.
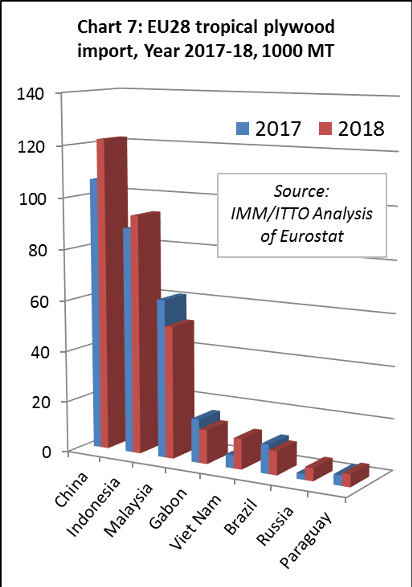
EU direct imports of plywood from the tropics down 5% in 2018
The EU imported 327,200 MT of tropical plywood in 2018, 2% more than in 2017. Import value increased 2% to €290.9 million in 2018.
Direct EU imports of plywood from tropical countries decreased 5% to 192,100 MT in 2018. While imports from Indonesia increased 6% to 93,400 MT, imports from Malaysia fell 16% to 51,800 MT, imports from Gabon were down 22% at 13,300 MT, and imports from Brazil fell 17% to 9,300 MT. Although still only minor suppliers, during 2018 there was a significant 133% increase in EU imports of plywood from Viet Nam, to 11,900 MT, and a 22% increase from Paraguay to 4,900 MT.
The EU imported 121,900 MT of plywood faced with tropical hardwood from China in 2018, ending the year 15% up on the previous year following a surge in the last quarter. Imports from China earlier in 2018 were disrupted to some extent by tough new national environmental controls which forced Chinese mills to interrupt production to upgrade or replace emission and waste treatment technology.
The EU also imported 13,100 MT of plywood faced with tropical hardwood from other non-tropical countries in 2018, 3% more than in 2017. Much of the gain was due to a 115% increase in imports from Russia, to 5,000 MT. (Chart 7).
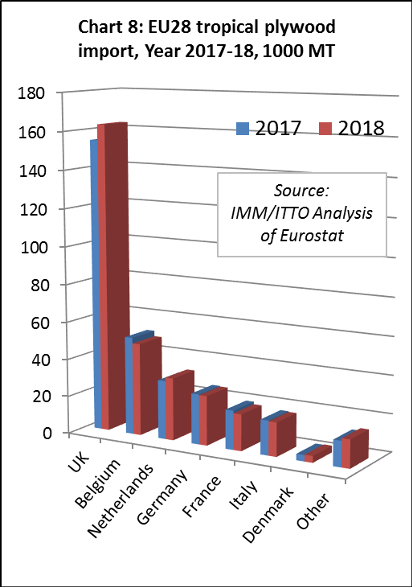
The UK imported 163,100 MT of tropical plywood in 2018, 5% more than the previous year. The UK is the main EU destination for tropical hardwood faced plywood from China and was also importing larger volumes of Indonesian plywood in 2018. Last year, tropical plywood imports also increased in the Netherlands (+6% to 33,100 MT) and Denmark (+7% to 3,500 MT). However, these gains were partly offset by falling tropical plywood imports in Belgium (-6% to 49,000 MT), Germany (-1% to 26,300 MT), France (-7% to 19,300 MT), and Italy (-2% to 17,900 MT) (Chart 8).
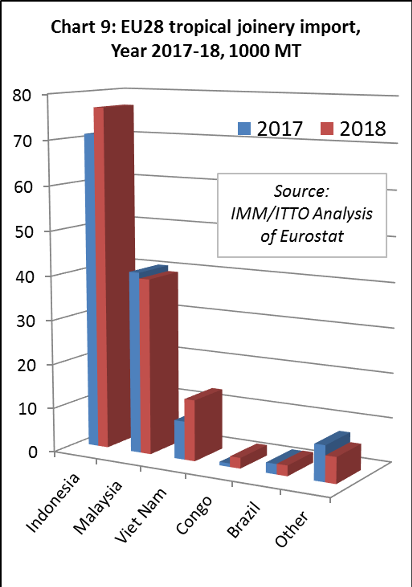
Indonesia, Vietnam and Congo boost share of EU tropical joinery imports
EU imports of tropical joinery products (excluding flooring) increased 7% to 140,800 MT in 2018. Import value increased 2% to €270 million. This category includes a range of wood products, but mainly doors, laminated kitchen tops, and window scantlings from the tropics.
In quantity terms, imports from Indonesia, by far the EU’s largest tropical supplier of joinery products, increased 8% to 76,800 MT in 2018. There was also a 59% increase in EU imports of joinery products from Viet Nam, to 13,800 MT. Imports from Congo increased from negligible levels to 2,400 MT. These gains offset a 3% decline in imports from Malaysia to 39,600 MT. (Chart 9).
Imports of tropical joinery products in the UK, the largest European destination for this product group, notably of doors from Indonesia, increased 16% to 61,300 MT in 2018. Last year, imports of tropical joinery products increased 23% to 17,700 MT in Belgium and were up 28% to 12,700 MT in France. However, imports fell 9% to 34,300 MT in the Netherlands and declined 16% to 8,600 MT in Germany.
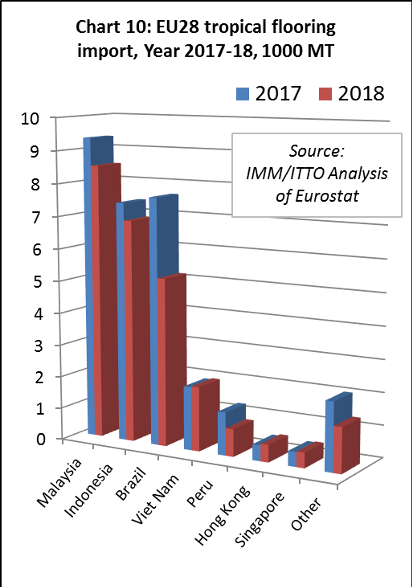
Another fall in EU imports of tropical flooring
EU imports of flooring products from tropical countries fell a further 16% to 25,900 MT in 2018, continuing a long term decline in response to tough competition from European and Chinese manufacturers and non-wood alternatives, fashion trends favouring temperate timbers, supply contraints, and challenges of EUTR conformance. The value of EU imports of tropical wood flooring declined 13% to €59.1 million in 2018.
Most of the downturn in 2018 was due to a 32% fall in imports of hardwood flooring products from Brazil, to 5,200 MT. However imports also fell 9% from Malaysia, to 8,500 MT, 7% from Indonesia, 6,900 MT, and 36% from Peru, to 900 MT. (Chart 10).
In 2018, imports fell dramatically in the two largest EU markets for tropical wood flooring, declining 36% to 5,600 MT in France and 19% to 3,300 MT in Belgium. However, this decline was partially offset by a 42% increase in imports in Denmark, to 2,700 MT, and a 21% increase in Spain, also to 2,700 MT.
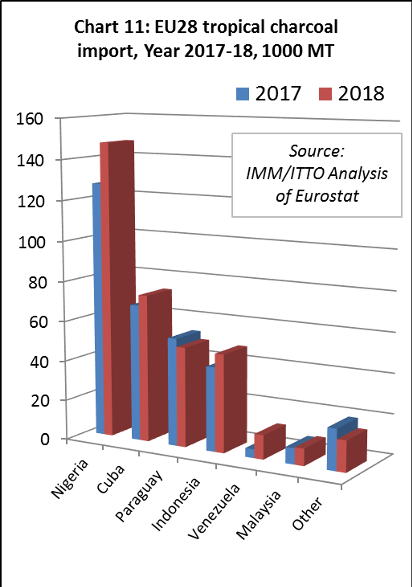
Another rise in EU imports of tropical charcoal
EU imports of charcoal from tropical countries increased 10% to 355,900 MT in 2018. The value of imports increased 11% to €139.8 million in 2018. EU imports increased from Nigeria (+16% to 147,600 MT), Cuba (+8% to 73,600 MT), Indonesia (+16% to 48,800 MT) and Venezuela (+177% to 12,000 MT). These gains offset a 7% decline in imports from Paraguay to 49,800 MT. (Chart 11).
A wide range of EU countries now import wood charcoal from tropical countries. The largest destinations (in descending order in 2018) are Poland (56,700 MT), Greece (49,500 MT), Germany (49,100 MT), Portugal (38,000 MT), Italy (32,100 MT), Spain (31,300 MT), UK (29,400 MT), Belgium (27,900 MT) and Netherlands (15,500 MT).
PDF of this article:
Copyright ITTO 2020 – All rights reserved