

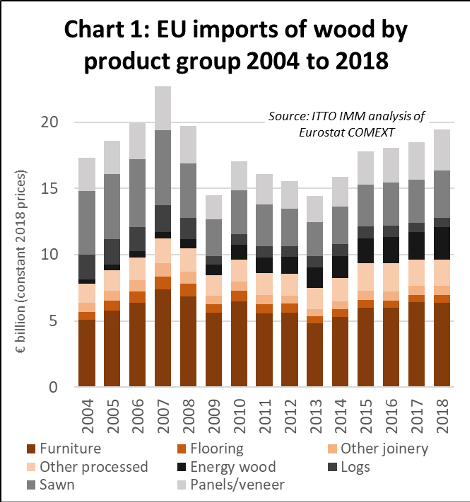
The total value of EU imports of wood products was 19.44 billion euro in 2018, 5.1% more than in 2017. This followed an increase of 2.4% to 18.49 billion euro in 2017. In 2018 EU import value was at the highest level since 2008 just before the global financial crises (Chart 1).
The rise in imports into the EU occurred despite slowing economic growth during 2018. According to the EU Winter 2019 Economic Forecast published on 7 February, economic activity in the EU moderated in the second half of last year as global trade growth slowed, uncertainty sapped confidence and output in some Member States was adversely affected by temporary domestic factors, including social tensions and uncertainty over fiscal policy and Brexit. As a result, GDP growth in both the euro area and the EU likely slipped to 1.9% in 2018, down from 2.4% in 2017.
Slowing economic growth fed through into a fall in the value of the euro and the British pound last year, both of which weakened against the U.S. dollar by around 8% during 2018. However, EU currencies remained strong relative to currencies in several key Eastern European supply countries, including Ukraine, Russia, and Turkey. Both the euro and British pound strengthened by around 7% against the Russian rouble in 2018 and by over 25% against the Turkish lira. These exchange rate fluctuations generally favored EU imports from Eastern Europe and acted as a drag on imports from North America and Asia.
Considering individual products (Chart 2), the value of EU imports of wood furniture decreased by 1% to 6.35 billion euro in 2018 after a 7% rise in 2017. A dip in EU imports of wood furniture from China and Norway was offset by rising imports from Ukraine, Belarus, Bosnia, Serbia, Russia and Turkey. This forms part of general trend of increasing EU dependence on wood furniture manufactured in central and Eastern Europe. EU wood furniture imports from tropical countries, led by Vietnam, Indonesia and Malaysia, were flat overall last year, although imports from India continued to rise.
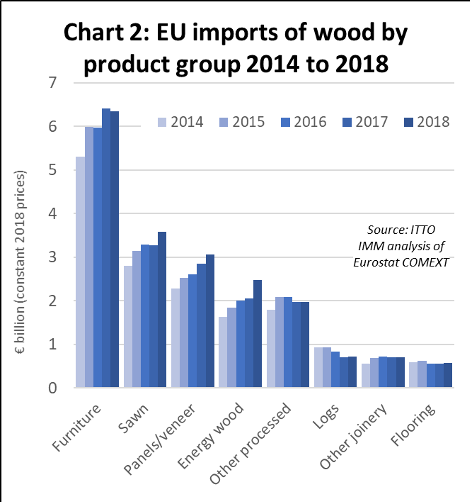
Growth in EU imports of sawn wood resumed in 2018 after flatlining the previous year. The total value of EU imports of sawnwood (including both softwood and hardwood) in 2018 was 3.59 billion euro, nearly 10% more than in 2017. There was a particularly significant 21% increase in the value of EU sawnwood imports from the CIS countries in 2018, building on an 11% increase the previous year. Most of the increase in sawnwood imports from CIS countries in 2018 came from Ukraine, Belarus and Russia and is due both to currency weakness and increasing controls on log exports from these countries.
EU imports of sawnwood, both softwood and hardwood, increased sharply from Brazil in 2018. Imports of tropical sawn wood from both South East Asia (most notably from Malaysia and Myanmar) and Africa (mainly Cameroon, Gabon and Congo) regained some ground in 2018 after a sharp fall the previous year. EU imports of sawnwood from North America slowed a little in 2018.
EU imports of panels (mainly plywood) increased 8% to Euro 3.06 billion in 2018. This follows a 9% rise in 2017 and is the fifth consecutive year of import growth of this commodity. As for other wood commodities, much of the gain was due to a rise in plywood imports from Russia, Ukraine and Belarus, however plywood imports from China, Brazil and Indonesia also increased in 2018. Imports of plywood and veneer from Gabon slowed in 2018, particularly affected by the financial problems of Rougier group. There was partial recovery in veneer imports from Cote d’Ivoire in 2018. EU imports of composite panels increased from Turkey.
The long-term rise in EU imports of energy wood accelerated in 2018 with annual import value rising over 20% to 2.47 billion euro. This followed a slowdown to only 3% growth in 2017 after average annual growth of 11% in the previous five years. There was another sharp increase in EU imports of energy wood from the United States in 2018 (now dominated by pellets), to reach over 1 billion euro for the first time, with most destined for the UK. Imports of energy wood also increased sharply from Russia, Belarus and Ukraine, mainly destined for continental EU. Import growth also resumed from Brazil and Uruguay.
EU imports of other joinery products (mainly doors and laminated wood for window frames and kitchen tops) increased 1% to Euro 710 million in 2018, recovering from a 1% fall the previous year. Imports of joinery products from Russia, Ukraine and Belarus continued to rise last year, with gains also made by Indonesia, Vietnam, Bosnia, and Turkey. China continued to lose ground, although it maintained its position as the single largest external supplier of this commodity group in the EU market, just ahead of Indonesia. EU imports of joinery products were stable from Malaysia in 2018.
After falling back 9% in 2016 and staying flat in 2017, EU imports of wood flooring increased 2.6% to 580 million in 2018. Flooring imports from China, by far the largest external supplier accounting for around two thirds of the total, recovered ground in 2018, while imports from Ukraine increased sharply, helping to offset a decline in imports from Indonesia, Malaysia, Brazil and Switzerland.
Stabilization of EU tropical timber imports
The total value of EU imports of tropical timber products (including direct imports and imports via third countries such as China) increased 1.7% to 4.05 billion euro in 2018. This follows a 0.4% fall in import value in 2017.
The share of tropical timber in the total value of EU wood product imports declined from 21.5% in 2017 to 20.8% in 2018. Although 2018 was the third straight year of declining share for tropical timber, the rate of decline is now much slower than in the decade prior to 2014 when share fell continuously from around 36% to 22% (Chart 3).
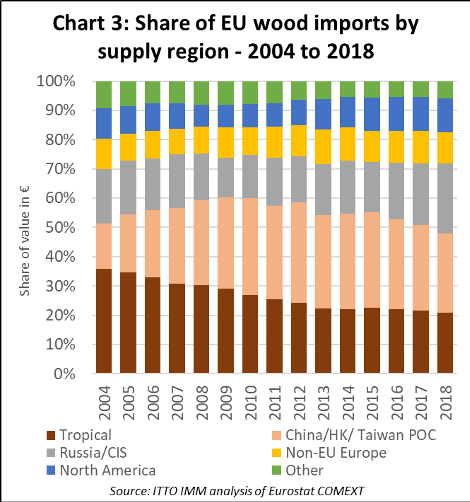
China’s share in total EU imports of timber products fell from 29.4% in 2017 to 27.2% last year, the lowest level since 2007. Meanwhile the share of Russia and other CIS countries increased from 21.0% to 23.9%. In 2018, there was a slight decrease in share of EU imports from non-EU European countries (from 11.1% to 10.6%) and North America (from 11.7% to 11.6%).
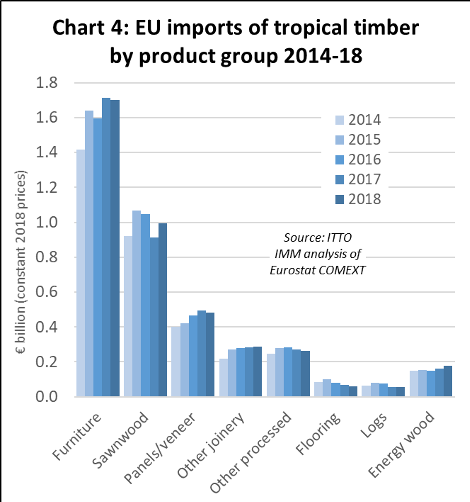
The slight increase in the total value of EU wood product imports from the tropics in 2018 hides variations between products groups (Chart 4). In 2018, there was a 9% increase in EU imports of tropical sawn wood, from 914 million euro to 996 million euro, a rebound following the 13% decline the previous year. There was also an increase in imports of energy wood from tropical countries, rising from 160 million euro in 2017 to 179 million euro in 2018, with the biggest gains comprising charcoal from Nigeria and other forms of fuelwood from Congo and CAR.
The value of EU imports of other tropical products – including furniture, joinery, plywood, veneers, and logs – were either flat or declining in 2018. The decline in imports of tropical flooring was particularly dramatic, down 15% to 59 million euro in 2018, following on from an average decline of around 15% in each of the previous three years.
The value of EU imports of all wood products from the two leading tropical suppliers, Indonesia (813 million euro) and Vietnam (812 million euro) was stable in 2018. Total import value declined from Malaysia (by 5% to 519 million euro), Gabon (by 5% to 163 million euro) and Thailand (by 13% to 90 million euro). (Chart 5)
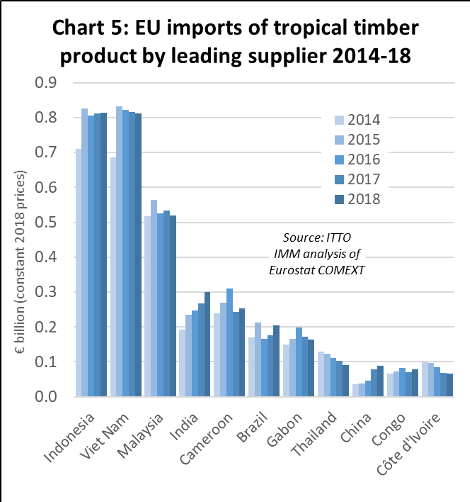
However, these declines were offset by rising imports from India (by 12% to 299 million euro, mainly furniture), Brazil (by 16% to 205 million euro, mainly hardwood sawnwood and decking), and China (by 15% to 89 million euro, mainly tropical faced plywood). There was also recovery in imports from some African countries, mainly of sawn wood, including Cameroon, by 4% to 252 million euro, and Congo, by 12% to 79 million euro.
Shifting destinations for EU timber imports
There are significant shifts on-going in destinations for EU imports of timber products. After emerging as by the largest single market in the EU for timber products from outside the bloc between 2011 and 2015, the relative importance of the UK eased a little in the 2016 to 2018 period. The UK’s share of total EU imports of timber products from outside the region declined from a peak of 27.6% in 2015 to 25.0% in 2018. (Chart 6).
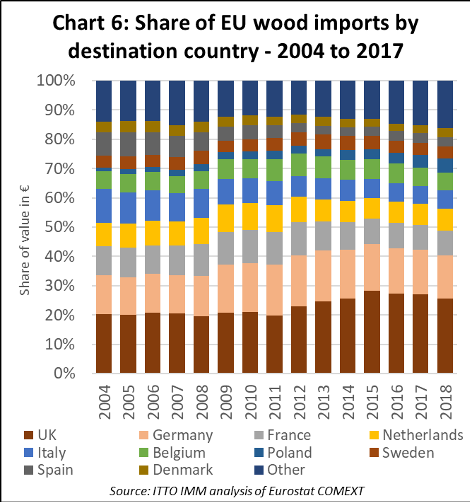
The UK’s emergence as the leading EU market for external timber suppliers between 2011 and 2015 coincided with relatively strong economic growth in the country and rising consumer demand. This drove a strong increase in imports from outside the EU, particularly wood furniture and plywood from China, and wood furniture from Vietnam. There was also a big increase in UK imports of wood pellets, mainly from the U.S., driven by the UK’s climate change commitments which encouraged some large energy suppliers to switch from coal to biomass.
However, between 2016 and 2018, growth in the UK economy slowed, particularly with rising uncertainty over the effects of Brexit, currently scheduled for 29 March 2019 (but may be delayed for at least a few months, although nobody yet knows for sure). The British pound also weakened significantly on foreign exchange markets during this period, dampening import growth.
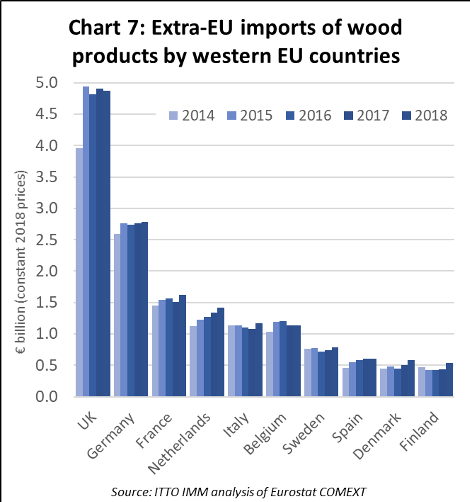
Against this background, the fact that the Euro value of UK imports from outside the EU remained flat at around 4.9 billion euro between 2016 and 2018 is a positive outcome. During the same period, imports from outside the EU by most other western European countries also remained quite flat (Chart 7).
The Netherlands is an exception, experiencing strong import growth, rising consistently from a low of 1.03 billion euro in 2013 to 1.42 billion euro last year on the back of economic recovery and rising construction activity in the country. The Netherlands is also playing a larger role as a gateway for imports for distribution throughout the EU.
In 2018, there was also a significant recovery in the value of imports of timber products from outside the EU by two countries that formerly were leading players in the global timber trade but have since waned in significance; France (up 8% to 1.62 billion euro), and Italy (up 8% to 1.17 billion euro).
In the case of France, imports increased sharply from China (notably in furniture) in 2018, with gains also made in imports from Vietnam (furniture), Brazil (hardwood decking), and Russia (sawn softwood). For Italy, imports in 2018 increased from Russia (mainly plywood), Ukraine (mainly sawnwood), Bosnia (mainly energy wood), Brazil (softwood plywood), Cameroon (sawnwood) and Myanmar (sawnwood).
Rising share of EU timber imports destined for Eastern Europe
While there was some increase in imports by a few western European countries in 2018, eastern EU countries recorded much larger and more consistent gains in imports from non-EU countries last year. Large increases were recorded in Poland, Romania, Lithuania, Latvia, Estonia, Slovenia, Czech Republic, Croatia, Hungary, Bulgaria, and Slovakia (Chart 8).
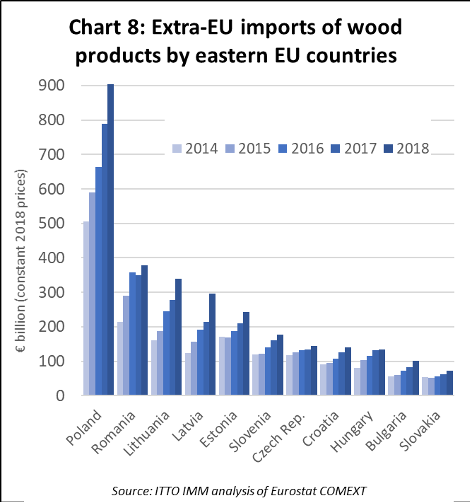
This is a reflection both of their proximity to Russia, Ukraine and Belarus, the source of most of the rising imports, relatively higher rates of economic growth and construction sector growth in Eastern Europe, and the establishment of new wood processing and manufacturing capacity in the region.
EU wood products exports at record level in 2018
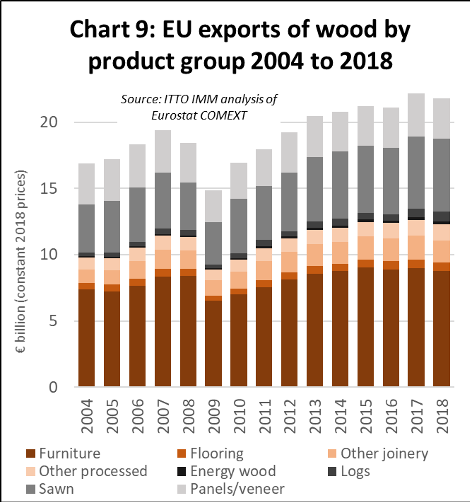
In 2018, the EU exported wood products with a total value of 21.8 billion euro, 2% less than in 2017 when exports were at record levels (Chart 9). EU exports of wood furniture, flooring and other joinery products, and plywood and other panels all slowed last year, a response to general cooling in the global economy.
However, EU exports of logs and sawnwood continued to increase in 2018 to record levels for these commodities, exports of sawnwood up 2% to 5.54 billion euro and exports of logs rising by over 14% to 735 million euro.
In 2018, the value of EU timber product exports continued to rise to the USA but was flat or declining to the other leading export markets including Switzerland, Norway, China, Japan, Russia, Egypt and Algeria.
The combined effect of last year’s fall in EU export value and rise in EU import value was to reduce the EU’s trade surplus in timber products with the rest of the world from 3.70 billion euro in 2017 to 2.38 billion euro in 2018.
PDF of this article:
Copyright ITTO 2020 – All rights reserved