

The FLEGT Independent Market Monitoring (IMM) mechanism, which is hosted by ITTO with EC funding, has just launched a new website at www.flegtimm.eu. The first edition of the free IMM Newsletter can be accessed at the website and there is also the opportunity to sign up to future editions which will be released at least quarterly.
The IMM, which began operation in 2014, uses trade flow analysis and market surveys to independently assess market impacts of FLEGT Voluntary Partnership Agreements (VPAs). During 2017, the IMM expanded its market research programme to cover seven key EU countries, which account for roughly 90% of EU tropical timber imports from VPA partner countries.
IMM market research has been based on online surveys and structured interviews with trade representatives, government agencies and NGOs. This market research programme runs alongside IMM’s analysis of trade flow statistics and other timber trade related data, most recently presented in the IMM report “FLEGT VPA Partners in EU Timber Trade 2014 to 2016” (also now available at www.flegtimm.eu).
The IMM Newsletter includes insights from the IMM EU market scoping surveys as well surveys of Indonesian and Ghanaian companies exporting forest products into the EU. It also covers an analysis of EU-Indonesia timber trade since the start of FLEGT licensing and background information on how the Indonesian system works, as well as analysis of FLEGT-licensing teething troubles and EU economic trends.
Interviews with Mike Worrell of the UK Timber Trade Federation and Dr Rufi’ie of the Indonesian Ministry of Environment and Forestry provide further insights into Indonesian FLEGT licensing, while VPA Joint Implementation Coordinator Edwin Shanks explains next steps towards VPA implementation in Vietnam.
The IMM website will be developed further in 2018, providing constantly updated data on EU timber trade and market trends, as well as details of IMM research and activities.
EU wood furniture surplus narrows as imports rise
The EU has maintained a trade surplus in wood furniture since 2011 when exports to non-EU countries overtook imports from outside the EU. This surplus remained broadly flat between the start of 2015 and the first quarter of 2016 (averaging close to €3 billion per annum), as both imports and exports were stable. However, the trade surplus narrowed sharply in the second and third quarters of 2017 (to around €2.6 billion per annum) as imports began to pick up. (Chart 1).
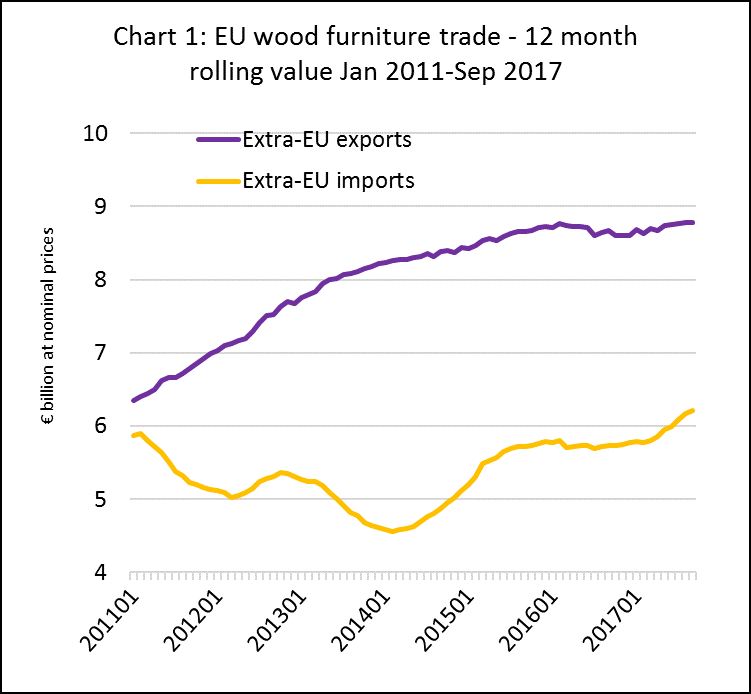
The narrowing of the EU trade surplus is an encouraging sign for external suppliers of wood furniture into the EU that have struggled to compete in a market where domestic suppliers account for around 85% of total share. The dominance of EU manufacturers in this sector is due to various factors including the strength of domestic brands in terms of innovation and design, the obstacles to overseas suppliers complying with complex EU technical and environmental standard, and the expansion of furniture manufacturing in Eastern Europe, a location which combines ready access to raw materials, relatively cheap labour, and the internal EU market.
Improved economic conditions in Europe have been driving a rise in wood furniture consumption in the last three years. Rising consumption combined with the growth of manufacturing in Eastern Europe, particularly in Poland, Romania and Lithuania, is reflected in a rapid rise in EU internal wood furniture trade, from an annual level of €15 billion at the start of 2014 to nearly €19 billion by the end of 2017 (Chart 2).
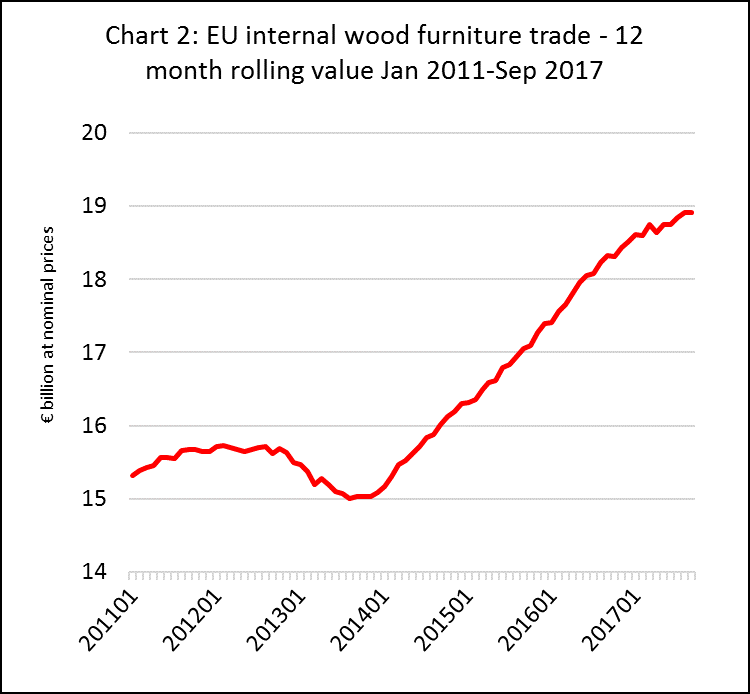
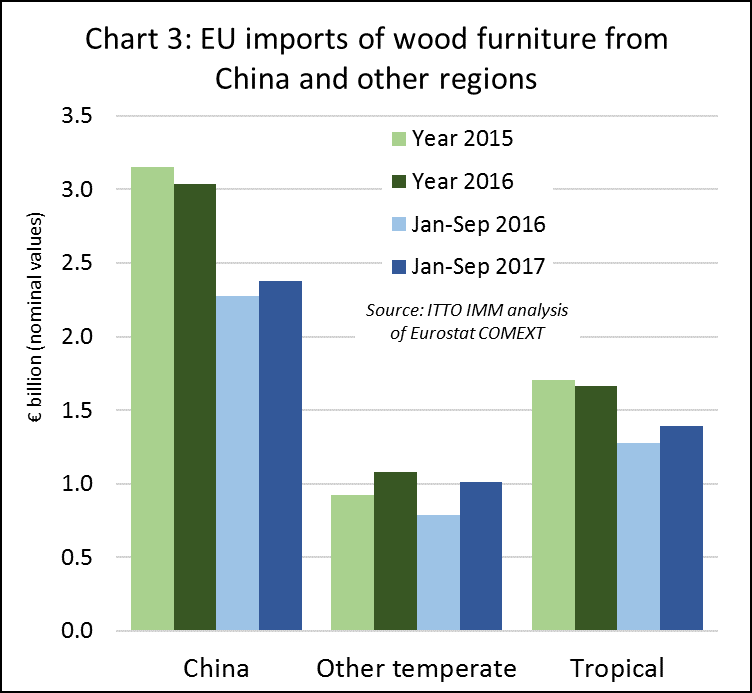
The pace of the rise in internal EU wood furniture trade tailed off a little during 2017. However, last year there was a rise in the pace of EU wood furniture imports from outside the region. Between January and September 2017, the EU imported €1.39 billion of wood furniture from tropical countries, nearly 9% more than the same period the previous year. EU imports from China also increased, by 4% to €2.38 billion in the same period.
However, the biggest gains in EU imports of wood furniture in 2017 were from other temperate countries, notably Bosnia, USA, and Ukraine. EU imports from these countries increased 28% to €1.01 billion in the first 9 months of 2017, building on a 14% gain recorded the previous year. (Chart 3).
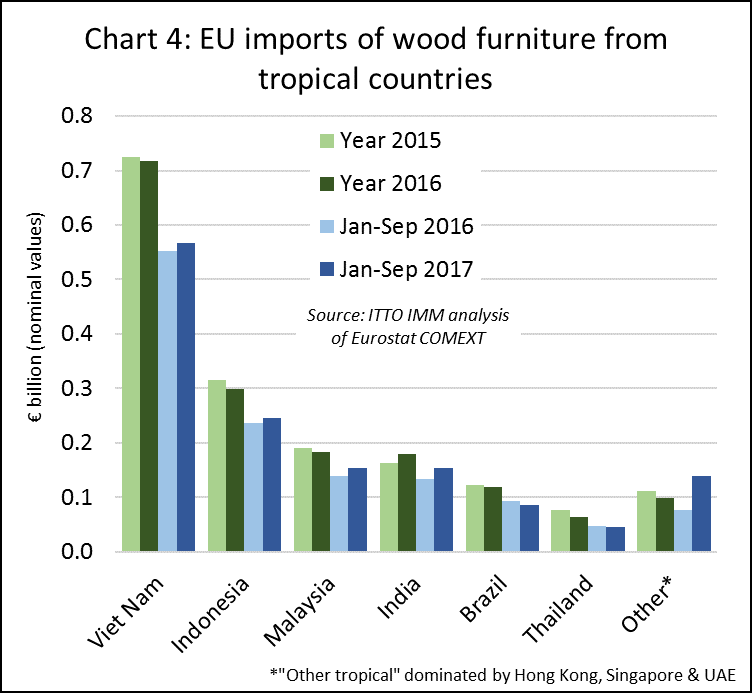
In the first nine months of 2017, EU imports increased from all four leading tropical supply countries; rising by 3% from Vietnam to €567 million, 4% from Indonesia to €246 million, 11% from Malaysia to €154 million and 16% from India to €154 million. There was also a significant rise in EU imports from Hong Kong, Singapore and the UAE during the same period. In contrast imports from Brazil fell 8% to €85 million and imports from Thailand declined 6% to €45 million (Chart 4).
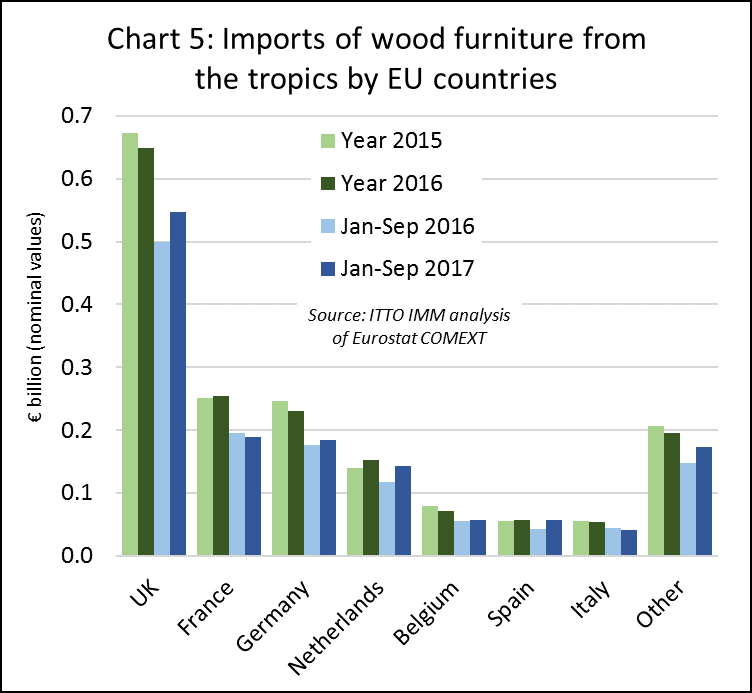
The increase in EU imports of wood furniture in the first nine months of 2017 was concentrated in the UK (rising 9% to €546 million), Germany (rising 4% to €185 million), Netherlands (rising 21% to €142 million) and Spain (rising 31% to €57 million). Although the quantities are still quite limited, several smaller EU markets also recorded significant percentage increases in wood furniture imports from tropical countries in 2017 including Sweden, Denmark, Poland, Ireland and Greece. (Chart 5).
China overshadows global furniture production
Total furniture production in the world’s 100 largest countries, by GDP, was valued at US$430 billion in 2017. This is a key conclusion of “World Furniture Outlook 2018”, the flagship publication of CSIL, the Italian furniture research organisation. The report includes details of the furniture sector in 100 countries which account for 90% of world population and 95% of world GDP. The report considers furniture in all materials but excluding lamps and mattresses.
The CSIL report highlights the extent of China’s dominance as the world’s largest furniture manufacturer. Last year China alone accounted for nearly 40% of global production. USA, the second largest producer, accounted for 12%, followed some way behind by Germany (5%), Italy (4%), India (4%), Poland (3%), Japan (2%), Vietnam (2%), UK (2%) and Canada (2%).
The CSIL report shows that international trade in furniture was US$140 billion in 2017, corresponding to around 1% of total global trade in manufactured goods. After a sharp rise in the value of global furniture trade in the decade prior to 2012, trade has remained broadly flat in the past five years.
Furniture exports in China, the largest exporter, were around $51 billion in 2017, a slight gain on the previous year but lower than in 2015. Exports in Germany and Italy, the next largest exporters, were both valued at around $11 billion in 2017, a level that has hardly changed in the last 8 years. However, exports have been rising in Poland and Vietnam, reaching around $10 billion and $8 billion respectively in 2017.
The US is the world’s largest furniture importer, with imports of around $34 billion in 2017 having risen continuously from only around $24 billion in 2010. The value of imports in the next largest importing countries – Germany (around $13 billion in 2017), the UK ($7 billion), France ($7 billion) and Canada ($6 billion) – were broadly flat during the same seven-year period.
CSIL forecast that global consumption of furniture will rise by 3.5% in real terms in 2018. The fastest growing region continues to be Asia, with all other regions growing between 1% and 3% in real terms.
While China’s furniture production continues to rise rapidly, export growth is more subdued according to CSIL. Drawing on commentary from Chinese manufacturers, CSIL reckons that Chinese furniture export growth is unlikely ever to return to levels seen earlier this decade for several reasons including: rising labour rates in China; the progressive appreciation of the Renminbi against the US dollar between 2003 and 2016; rising competition particularly from Vietnam; and the rapid growth in China’s internal demand. Currently around 30% of China’s furniture production is exported, but this proportion is gradually declining as more product is sold into the domestic market.
For further details: https://www.worldfurnitureonline.com/research-market/world-furniture-outlook-0058524.html
Growth in hospitality sector creates new opportunities
According to recent CSIL research carried out with focus on 16 Western European countries, the total value of the European market for contract furniture and furnishings in 2016 was €7.5 billion while total production was 9 billion. The sector was expanding in 2016 with yachting, luxury retail, and the hospitality sectors (hotels, bars and restaurants) being the fastest growing segments while sectors dependent on public funds, such as schools and hospitals, were much less dynamic.
CSIL has also carried out detailed research on the global development of hotel rooms, a sector significant for tropical hardwoods due the relatively large amount of higher end furniture and finishing materials used. CSIL estimate that in 2016 the total global stock of hotel rooms was 16 million with most recent growth in the Asia-Pacific region. Between 2012 and 2016, the share of hotel room in the Asia Pacific region increased from 22% to 26%, while the share declined in Europe from 30% to 28% and in North America from 41% to 38%. The share of hotel rooms in Africa, the Middle East, and South and Central America remained stable with values ranging between 3% and 5%.
CSIL estimate that 650,000 hotel rooms were under construction globally in 2016, of which 40% were in Asia-Pacific, while North America accounted for 29% and Europe only 10%. However, demand for new hotel rooms is expected to remain high in all regions with the glow flow of tourists forecast to increase 3% per year on average until 2030.
While Asia-Pacific has seen the most recent growth, the US continues to be the leading world market for hotel furniture and furnishings, accounting for 36% of total global demand in 2016. The Asia-Pacific region is now the second largest market, accounting for 28% in 2016, overtaking Europe which accounted for 26%, followed by Africa and the Middle East (7%), and Central and South America (3%).
Total sales of hotel furniture and furnishings were at a similar level in the United States and China in 2016, in the region of $5 billion in each country. Other large markets with demand between $1 billion and $5 billion are Germany, the UK, Japan, Canada and Russia. Countries currently with smaller markets but where demand is rising rapidly include Australia, UAE, Thailand, Indonesia, Singapore, and the Philippines.
CSIL estimates that the rate of worldwide construction of hotel rooms is likely to have increased nearly 10% in 2017 to 710,000, with Asia-Pacific accounting for 37% of the total, North America for 33%, the Middle East for 12%, Europe for 10%, Africa for 5% and South America for 4%. CSIL expect that this rapid rate of growth will continue in 2018.
PDF of this article:
Copyright ITTO 2020 – All rights reserved