

While there are clear signs that the EU economy is picking up, EU trade in tropical timber continues to slide. Market trends in producer countries and other consuming markets are now probably more important drivers of trade volumes into the EU than the current and potential level consumption in the region.
With tropical wood supplies constrained globally and strong demand elsewhere, particularly in China, and the additional challenge of satisfying EUTR due diligence requirements in the EU, tropical suppliers seem more inclined to focus on other markets.
The total value of EU imports of tropical timber products was €1.65 billion in the first nine months of 2017, 5% less than the same period in 2016. In quantity terms, imports into the EU between January and September 2017 were 1.53 million metric tonnes (MT), nearly 9% down on the previous year. The unit value of EU tropical timber imports has increased slightly this year, from €1039/MT to €1080/MT, mainly because imports of higher value products like plywood, glulam, veneer and decking have declined less than imports of unprocessed logs and sawnwood.
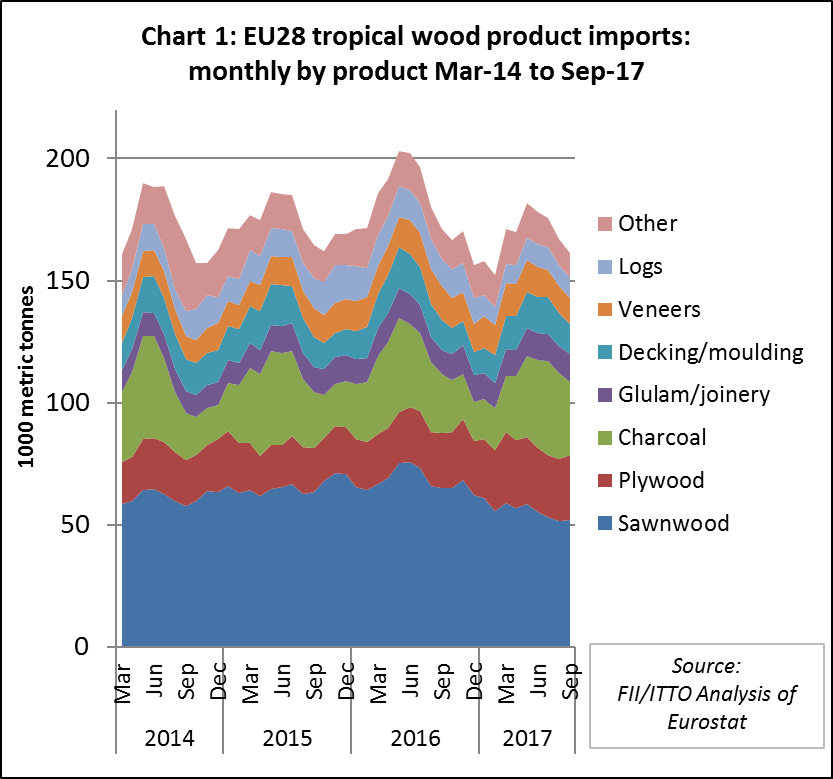
Although there was the usual seasonal rise in EU tropical timber imports in the first half of 2017, this was subdued compared to 2016 and imports declined sharply in the third quarter (Chart 1).
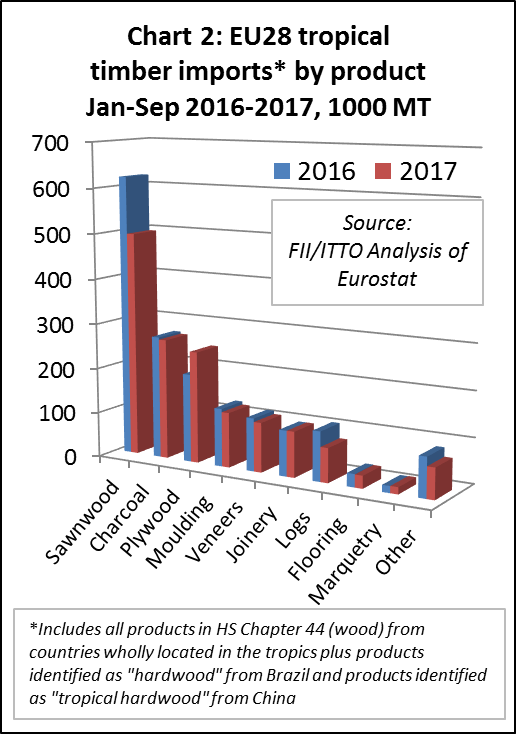
A large part of the decline in EU tropical timber imports in the first nine months of 2017 was concentrated in sawnwood, which in tonnage terms were down 20% compared to the same period in 2016.
During this period there was also a fall in import tonnage of tropical charcoal (declining 2% to 266,000 MT), decking/moulding (declining 5% to 122,000 MT), veneer (declining 6.3% to 110,000 MT), logs (declining 31% to 76,000 MT) and flooring (declining 3% to 28,000 MT) (Chart 2).
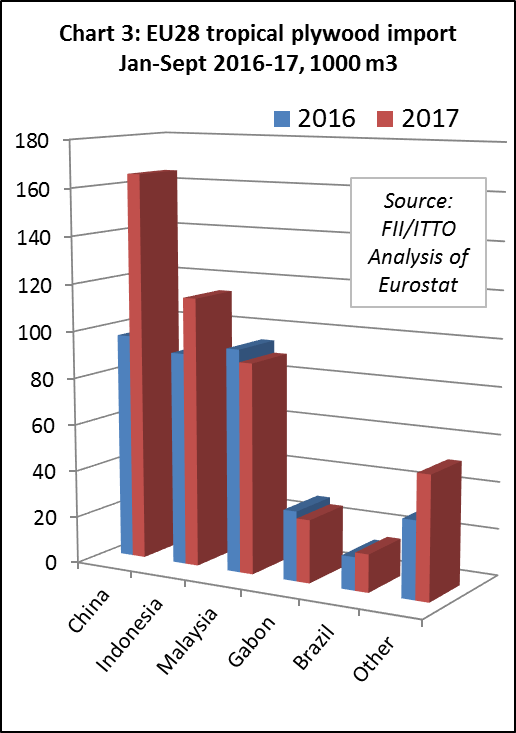
Tropical plywood apparently bucked this trend, with EU imports rising 30% to 464,000 m3 in the first nine months of 2017. However much of this gain comprised tropical hardwood plywood manufactured in China, rather than direct imports from the tropics, and may well be due to the increased range of hardwood types specifically identified as “tropical” rather than “other” in the HS product definition since the start of this year. (Chart 3).
The downturn in EU imports of tropical timber products during the first nine months 2017 was concentrated in Belgium (declining 20% to 300,000 MT), France (declining 22% to 194,000 MT), and Italy (declining 16% to 125,000 MT). The only market apparently recording significant growth in tropical timber imports during this period was the UK, rising 15% to 258,000 MT. (Chart 4).
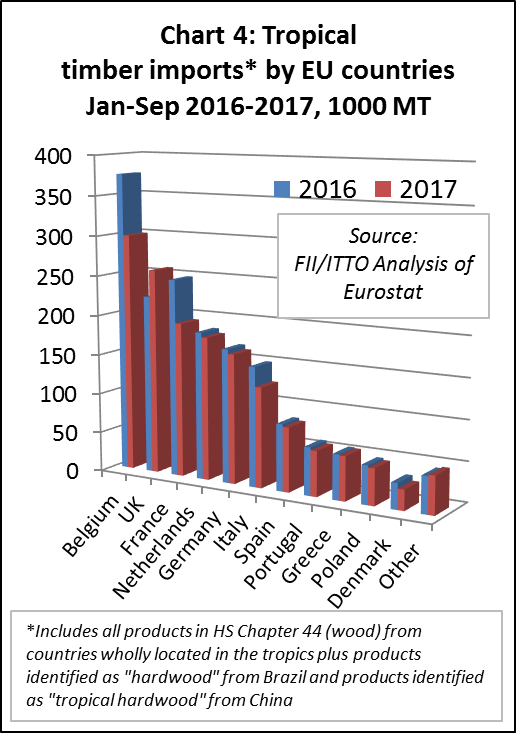
The apparent rise in tropical imports in the UK is misleading because this is by far the largest European destination for tropical hardwood plywood from China. Direct imports of tropical timber products into the UK have not posted significant gains this year.
EU sawn timber imports fall 21%
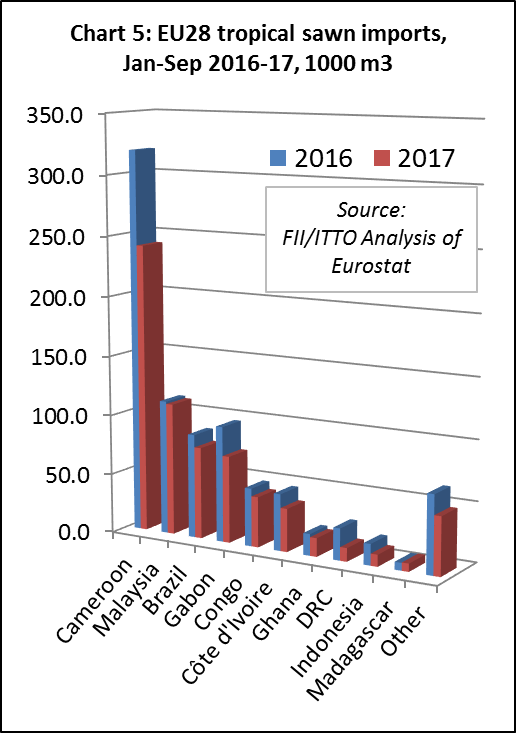
In volume terms, EU imports of tropical sawnwood were 670,500 m3 in the first nine months of 2017, 21% less than the same period in 2016. Although a large share of the decline was due to a 25% fall in imports from Cameroon (to 241,000 m3), there was a fall in trade with nearly all the main supply countries.
EU tropical sawnwood imports fell sharply from Brazil (declining 12% to 76,600 m3), Gabon (declining 25% to 72,500 m3), Congo (declining 13% to 42,100 m3), Cote d’Ivoire (declining 24% to 36,000 m3), Ghana (declining 14% to 15,500 m3) and DRC (declining 57% to 11,300 m3). Of major suppliers, only Malaysia maintained a level (110,000 m3) close to that of the previous year. (Chart 4).
In the first nine months of 2017, imports of tropical sawnwood declined into all the main EU markets, with the single exception of the UK. Imports were down 29% in Belgium (202,600 m3), 6% in the Netherlands (103,100 m3), 26% in France (80,200 m3), 35% in Italy (73,100 m3), 21% in Spain (45,200 m3), 14% in Germany (31,700 m3), and 10% in Portugal (22,200 m3). Imports in the UK increased, but by only 2% to 67,600 m3.
EU log imports fall from all leading tropical suppliers
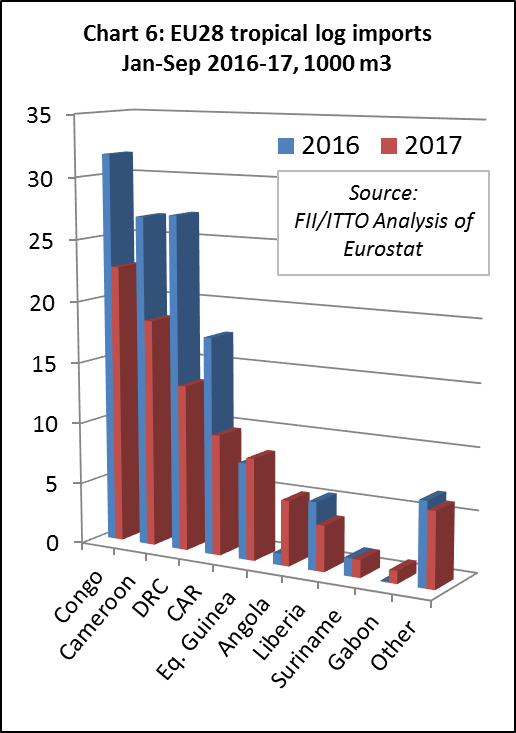
The EU trade in tropical logs followed a similar downward path. Imports in the first nine months of 2017 totalled just 90,400 m3, 28% less than the same period in 2016, and fell 29% to 22,700 m3 from Congo, 31% to 18,500 m3 from Cameroon, 50% to 13,500 m3 from DRC, and 44% to 9,800 m3 from CAR. However, there were gains in imports from some smaller suppliers, notably Angola (to 5,300 m3 from a negligible level in 2016). (Chart 5).
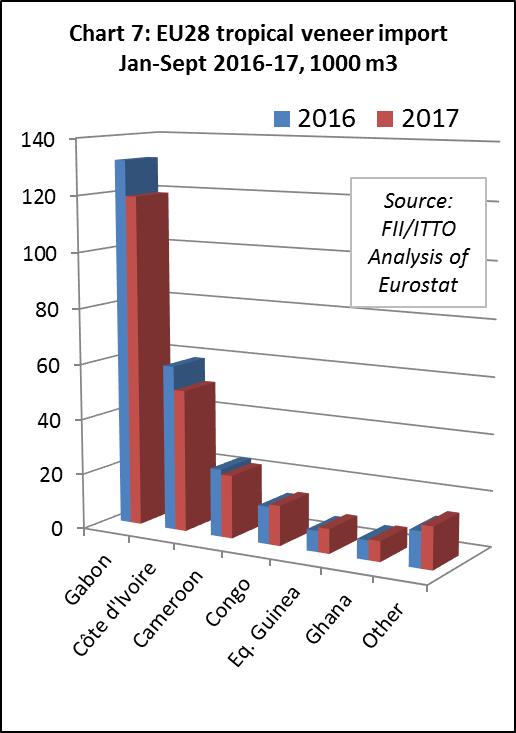
EU imports of tropical veneer declined 7% to 238,400 m3 in the first nine months of 2017, mainly due to a 10% fall in imports from Gabon to 119,000 m3. There was also a 14% fall in imports from Cote d’Ivoire to 51,100 m3, and a 7% fall in imports from Cameroon to 22,700 m3. However, imports increased from some smaller suppliers including Congo (rising 7% to 14,400 m3), Equatorial Guinea (rising 17% to 8,800 m3) and Ghana (rising 6% to 7,300 m3). (Chart 7).
Most of the decline in EU imports of tropical veneer was concentrated in the two largest EU markets; France and Italy. Tropical veneer imports increased in Spain, Greece and Romania during the nine-month period.
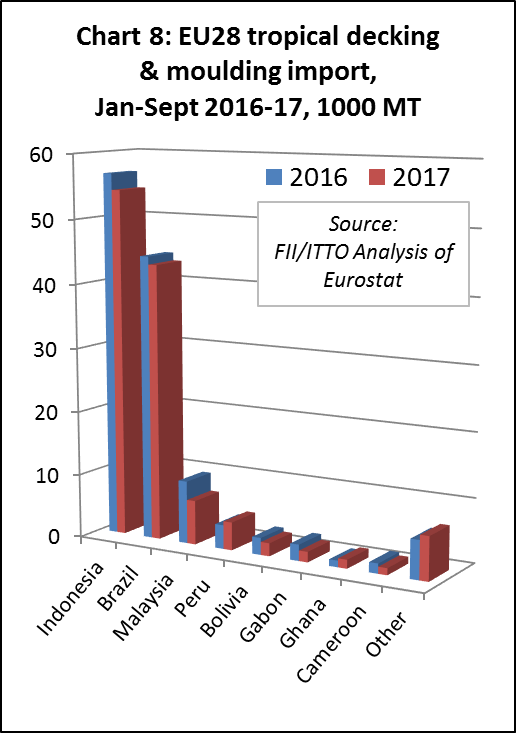
EU imports of moulding/decking were more stable than for other tropical products in the first nine months of 2017, falling only 5% to 121,000 m3. Imports declined 4% from Indonesia to 54,300 m3, 3% from Brazil to 43,100 m3, and 30% from Malaysia to 6,900 m3. There was a 17% gain in imports of mouldings/decking from Peru, but from a small base to 4,400 m3. (Chart 8).
Tropical glulam, mainly laminated window scantlings and kitchen, was one of the few tropical wood products to record an increase in EU trade in the first nine months of 2017, with imports rising 9% to 43,800 MT. Imports from Malaysia increased 31% to 19,800 MT but declined 2% from Indonesia to 16,500 MT and 1% from Vietnam to 4,600 MT.
Import decline despite economic growth
As noted in previous MIS reports, the downturn in imports is more disappointing because it is occurring at a time when there are clear signs that the EU is at last returning to economic health. In their Autumn statement issued in November, the European Commission said that the latest GDP statistics show that the EU “is on track to grow at its fastest pace in a decade this year.”
The EC forecast that the eurozone economy will grow by 2.2% this year and 2.1% next year, a significant improvement on their previous forecast in May (1.9% in both 2017 and 2018). For the whole EU, including non-eurozone countries, growth is expected to be a “robust” 2.3% this year and 1.9% next year – compared to 1.9% for both years that was expected in May.
The EC noted that for the first time in a decade all EU countries will grow this year. This was due, according to the EC, to “resilient private consumption, stronger growth around the world, and falling unemployment”. Investment in the EU is also “picking up” and confidence in the economy has “considerably brightened”, encouraged partly by the European Central Bank policy of low interest rates and massive bond buying.
The EC noted downside trends, notably ” sluggish wage growth” which “partly reflects low productivity growth and persistent slack in the labour market.” But for the first time, risks surrounding the economic outlook are considered by the EC to be “broadly balanced” instead of “tilted to the down side”.
PDF of this article:
Copyright ITTO 2020 – All rights reserved