

1. Key business sentiment indicators
Drawing on Eurostat data, the four charts below provide a snapshot of recent trends in market sectors important to the European wood industry. Data is provided for the EU as a whole and for the seven EU countries that are the largest individual markets for Chinese wood products in Europe. Overall, they indicate low levels of business confidence and particularly weak activity in the European construction sector. However there are some signs of recent improvements in business confidence in a few EU Member States in September and October 2012.
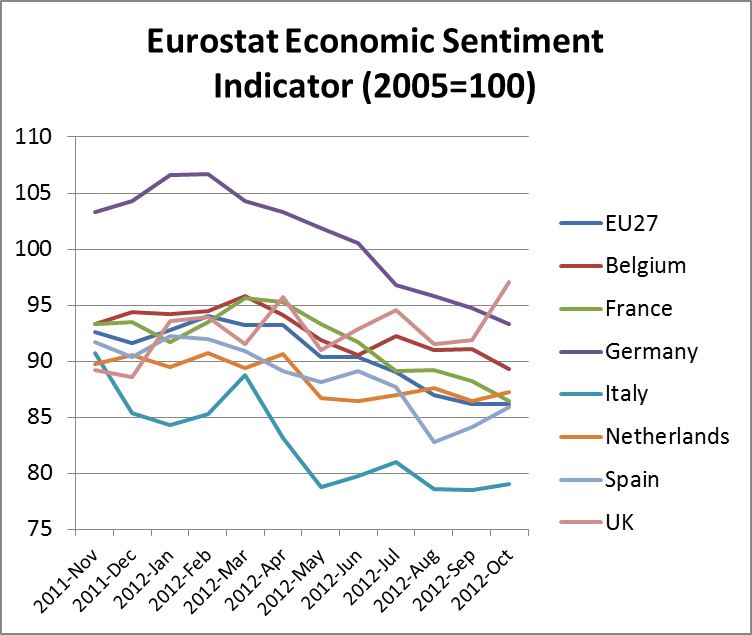

The Economic Sentiment Indicator[i] shows that the overall level of business confidence in the EU-27 fell progressively between February 2012 and September 2012. This trend was linked to mounting concern about the euro’s future and austerity measures by European governments. In October 2012, the overall decline in business confidence eased and there were early signs of rising optimism in a few countries, notably the UK and Spain. However, there has been a continuing decline in business confidence in Germany. This is a major concern because Germany has been the main source of European growth during the last 2 years.
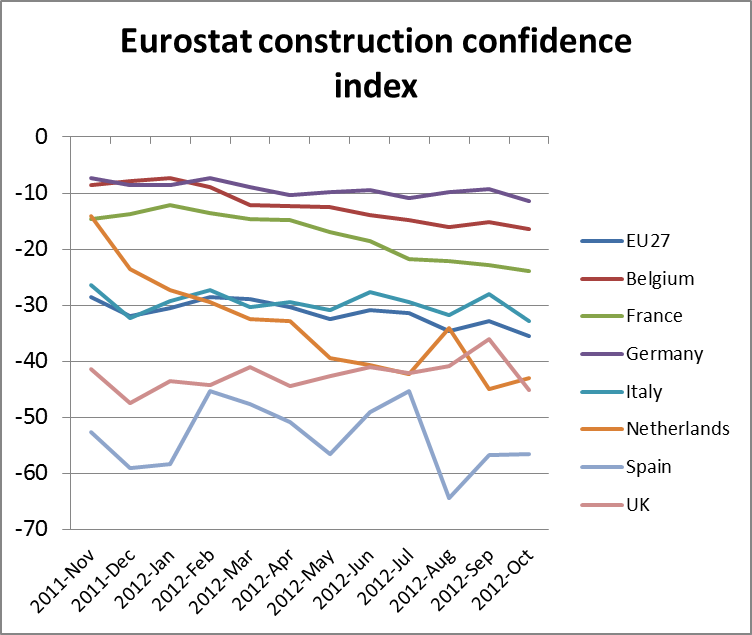
The Construction Confidence Index (CCI)[ii] shows that business confidence in the European construction industry remains well below levels prevailing prior to the financial crises. In most countries, the construction sector is generally expecting the decline in order books and employment levels to continue into the future. Construction market sentiment is particularly weak in Spain, Italy and the UK. It has also fallen dramatically in the Netherlands in recent months. Construction sector confidence is higher in Germany, France and Belgium.
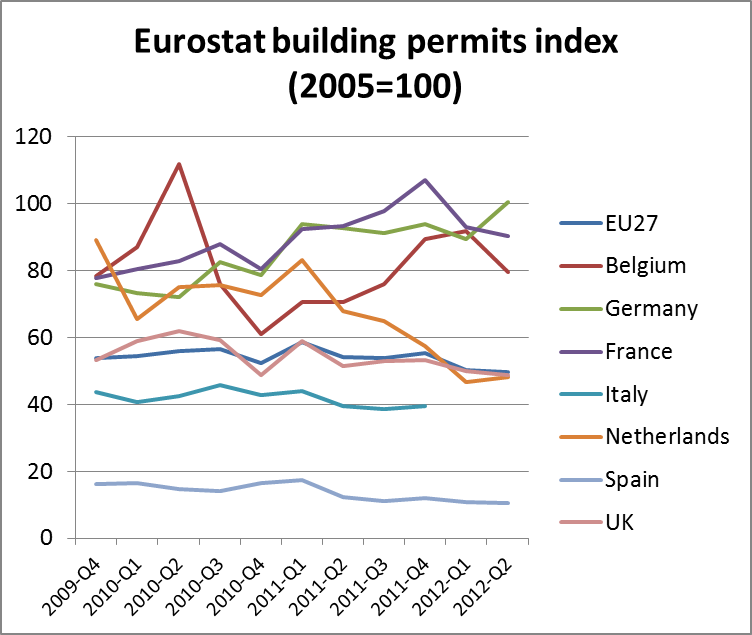
Trends in the CCI follow closely trends in the Construction Production Index[iii] and Building Permits Index[iv]. The Building Permits Index is particularly useful as it is a forward-looking indicator of likely levels of construction activity in the coming months. It suggests that construction sector activity will remain low and declining in the UK, Spain, Italy and the Netherlands at least until the spring season next year. However, activity should remain more consistent in Germany, France and Belgium over the winter months.
[i] The Economic Sentiment Indicator is prepared by Eurostat drawing on a regular monthly survey of perceptions and expectations in five surveyed sectors (industry, services, retail trade, construction and consumers) in all EU Member States. The indicator is calculated as an index with mean value of 100
[ii] The Construction Confidence Index is prepared by Eurostat drawing on a regular monthly survey of perceptions and expectations in the construction sector of all EU Member States. The indicator is calculated as net balance of the answers to two questions: level of current order books and employment expectations in the next 3 months. Balance is calculated as difference between positive and negative answers, expressed in per cent.
[iii]The Construction Production Index is a business cycle indicator which measures monthly changes in the price adjusted output of construction. Currently the index is calculated with 2005 as the base year (=100). Since construction output cannot be measured directly, the index is estimated by Eurostat using measures such as deflated gross production or input of labour and raw materials.
[iv] The Building Permits Index is a leading indicator providing information about the workload of the construction industry in the near future. The index is calculated with 2005 as the base year (=100) and refers to the number of permits issued. A building permit is the final authorisation to start work on a building project. It is granted by public authorities in response to an application based on a specific building plan. The permit doesn’t imply an obligation to start the construction and some permits might not be used by the builders. Therefore the index might overestimate future actual building projects. The index includes both residential and non-residential buildings but excludes civil engineering.
2. Key financial indicators
2.1 GDP growth
Quarterly GDP data for the EU-27 and individual European countries for the period to end June 2012 indicates a generally weakening economy (see Chart). A slowdown in Germany, Europe’s largest economy, added to the existing weakness in other European economies. Economic prospects in Italy have deteriorated particularly rapidly during 2012.
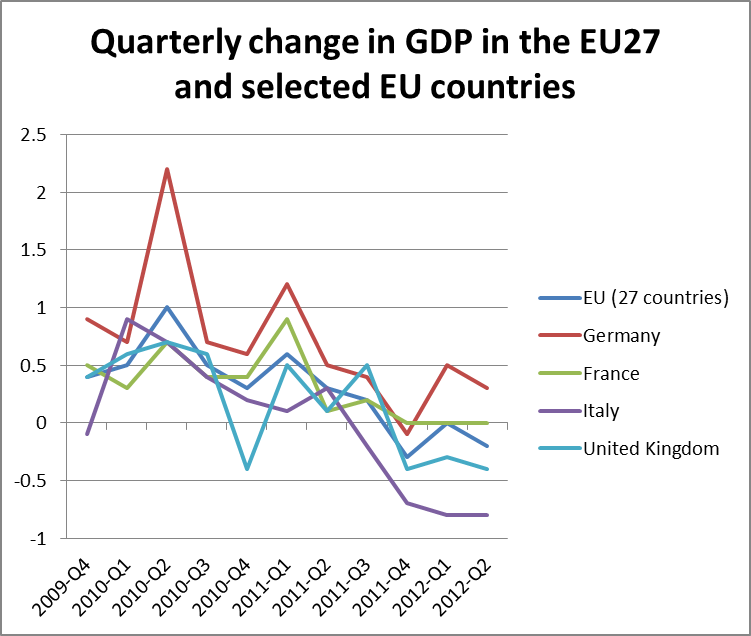
Third quarter GDP data for the EU as a whole has yet to be published. However prospects do not seem good. More reports of economic weakness in Germany have emerged in recent months.
German business confidence in September 2012 fell to the lowest in more than two years and the German unemployment rate rose from a two-decade low. Also, GDP in France fell by 0.1 percent during the third quarter of 2012. On the other hand, preliminary estimates suggest UK GDP may have increased by 1% in the third quarter of 2012 compared to the previous quarter.
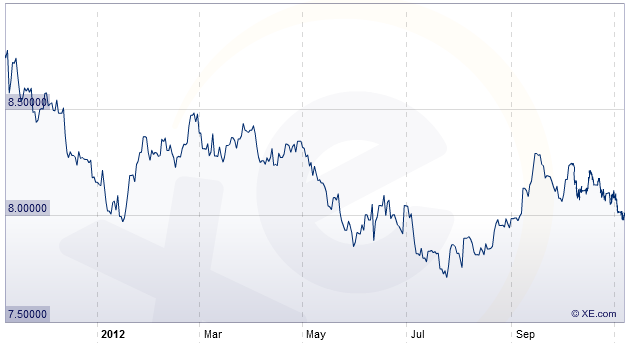
2.2 Exchange rates

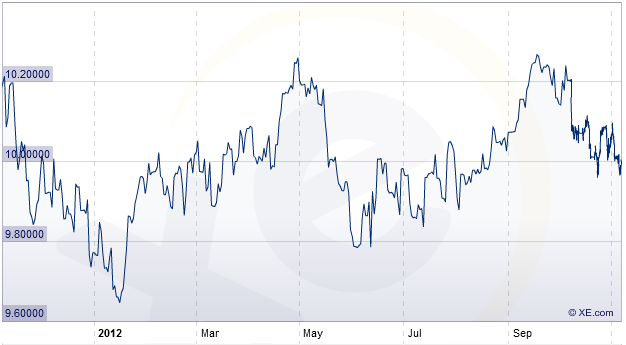
Chinise Yuan Reninbi per 1 Euro* Chinese Yuan Renminbi per GBP1*
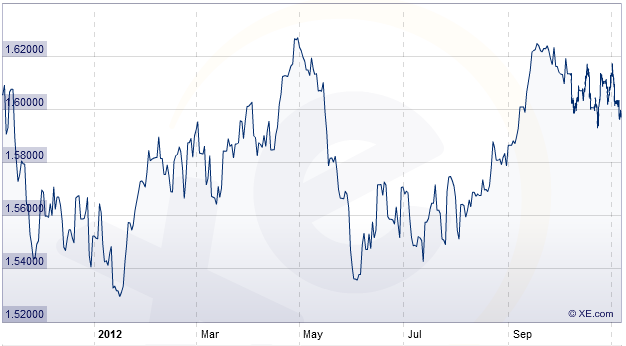
US$ per 1 Euro* US$ per GBP1*
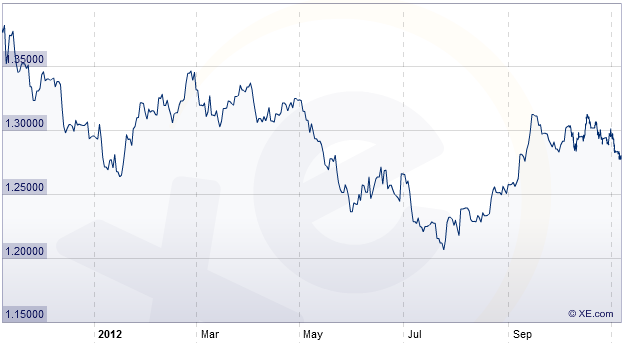
The value of the euro on international currency markets fell dramatically between April and July 2012. This was because of mounting fears over the future of the single currency due to the level of national debt in some EU Member States, notably Greece. However, the euro value has rallied since then. This was after the European Central Bank, the German Chancellor and other European leaders sent out stronger signals of their determination to do whatever it takes to safe the euro. For example, in September the European Central Bank unveiled details of a new bond-buying plan aimed at easing the euro zone’s debt crisis.
The GBP exchange rate has followed a similar path to the euro rate. It fell dramatically against the Chinese yuan and US dollar between May and June 2012. However it recovered ground in the third quarter of 2012 with signs of improving economic conditions in the UK.
2.3 Interest rates
Central Bank interest rates in Europe have been low and declining in recent times. The latest change in the European Central Bank rate for the euro-zone was on 7th May 2012 from 1% to 0.75%. The latest change in the Bank of England rate was in May 2009 from 1% to 0.5%. Low central bank rates are reflected in low and declining interbank lending rates (see chart).
Low interest rates in Europe have undoubtedly prevented economies from collapsing as they have helped boost consumption. There is still scope for interest rates to fall further. European Central Bank rates remain higher than in the US and Japan. This has been an important factor maintaining the relative strength of European currencies on international currency markets despite economic weakness and concerns about the future of the euro.
However, the European Central Bank has resisted calls for further reductions in rates. This is partly because of concern about inflation, particularly in Germany which has remained relatively buoyant. There are also question marks over whether further reductions in rates will actually improve the economic situation. With a huge overhang of debt, even lower rates aren’t expected to stimulate much more borrowing.
3. Wood flooring
3.1 Production and trade statistics
FEP’s analysis of data provided by European wood flooring companies indicates that production across the region in 2011 was 70.7 million m2, just 0.6% up on the previous year. While production has made a minor recovery from a low of 67.5 million m3 in 2009, in 2011 it remained 30% below the peak level of 100 million m2 recorded in 2007. Between 2010 and 2011, significant gains in flooring production in Hungary, Scandinavia, and Switzerland were offset by falling production in Spain.
There were shifts in the geographical distribution of European flooring production last year. Much production continues to be concentrated in Poland (18% of total European production in 2011), Germany (15%) and Sweden (13%). However FEP suggest that the 2011 figures need to be seen in the light of strategic choices by several producing companies which decided to relocate some production to other Eastern European countries outside the FEP territory. FEP estimate that without this shift of production location, the 2011 production would have increased by an additional 2 to 3%.
Meanwhile, parquet flooring consumption in the FEP area during 2011 decreased by 1.65% to 91.5 million m2. Consumption trends were highly variable between countries with little discernible pattern. There were big declines in consumption in Spain, Netherlands, Poland, Hungary, Belgium, and Denmark. These were offset by increases in consumption in Germany, Switzerland, Sweden and Austria. Germany consolidated its position as the leading market for wood flooring in Europe in 2011, accounting for 23% of consumption, followed by France (12%), Italy (10%), and Spain (10%).
Oak further strengthened its dominance in European finishing sectors during 2011, increasing its share of total parquet flooring production from 56% in 2008 to 67% in 2011. The major loser last year was tropical hardwood, which has seen its share of wood flooring produced in Europe drop from 14.7% in 2008 to only 7.4% in 2011. The 2011 data suggests little change in usage of other species between 2010 and 2011.
FEP data indicates that wood flooring accounted for around 5.8% of the total flooring market in Europe during 2011, trailing carpets (38%), stone/ceramics (26%), laminates (14%) and vinyl (13%). Market share of different materials has changed little over the last two years.
3.2 Market outlook
FEP forecast that the European wood flooring business for the rest of 2012 would “continue to evolve in parallel with the EC’s economic indicators, the latest version of which predicts that a recovery is in sight, but the economic situation remains fragile, with still large disparities across member states”. FEP also noted that “in the absence of further determined and focused action [to resolve the euro-crises], low growth in the EU flooring sector could remain”.
According to estimates made by the Federation of the European Parquet Industry (FEP), the trend on European parquet markets in recent months has tended to weaken slightly. At its last meeting on 17 October in Brussels, the federation’s executive board made a slight downward correction again to the estimates made in mid April. At that time, a positive trend had still been considered likely in Germany, Austria, Norway and Finland. That estimate has now been adhered to only for Germany, Austria and also for Switzerland. In contrast, for Norway and Finland, the FEP now considers stagnation likely. A tendency to stagnation had already been forecast in April for the whole of 2012 for France, Belgium, Denmark and Sweden. However, the FEP now reckons that decline is more probable in those countries. The downward trend in the Netherlands, Italy and Spain continues. In its latest market estimates the association’s executive board therefore sees the likelihood of a rather negative trend for seven of the twelve countries in 2012. From today’s perspective, two countries will close out 2012 with figures approximately at the level seen in 2011. The FEP currently considers that only the three DACH countries could conceivably show slight growth, although the trend in those markets has also slowed in comparison to the situation seen in the first half of the year.
4. Policies and regulations
4.1 EUTR at the top of the agenda for EU wood trade.
With less than a year to go before the EU Timber Regulation (EUTR) comes into force in March 2013, the new law is provoking heated and sometimes, frantic debate amongst EU wood importers and their trade associations. The EUTR presents major challenges as well as opportunities for the wood trade in general and American hardwoods in particular, and its long term impact is very hard to judge. Much hinges on the effectiveness of enforcement and on how key articles of the law will be interpreted in practice, both of which still remain uncertain.
Many hardwood importers are very concerned that, once the law enters into force, they will be in the firing line from activists and environmentalists determined to prove their involvement in illegal wood trading. In practice many are already changing their buying patterns, and trading less in tropical timber and concentrating more on temperate hardwoods which they perceive as low risk. Major changes are also expected in trade flows for finished products, such as flooring and furniture, as the EUTR may drive some retailers to source more of these products from closer to home, partially reversing the strong trend to procure more from Asia in recent times.
EUTR is expected to drive a renewed focus on certified supplies in the belief that this is the safest way of complying with the law, an attitude which the certification systems are seeking to exploit through adaptations to their chain of custody systems so that they align more closely with the requirements of the EUTR.
EUTR requires all operators that first place timber on the EU market to implement a due diligence system (DDS) to minimize the risk of any illegal wood entering their supply chains. The EUTR goes some way in defining what this DDS should look like, for example it must include risk assessment and mitigation procedures, and “access to information” on the composition and sources of wood products. The latter information includes the species composition of all wood products, country of harvest and “where applicable” more detailed information on “concession of harvest”, and “documents or other information indicating compliance of those timber and timber products with the applicable legislation”.
To drive implementation of the DDS, EUTR imposes a prohibition on operators trading products derived from illegally harvested timber within the EU. However, operators are innocent unless proven guilty. There is no obligation to positively prove legality in order to place timber on the EU market. Instead, European authorities must prove that a timber product derives from an illegal source to prosecute under the prohibition article of EUTR.
4.2 Moves to mandatory VOC labelling in Europe
Construction Products Directive (CPD) and Construction Products Regulation (CPR) contain a chapter on hygiene, health and the environment, basically saying in very general terms that any construction work must not pose any harm to hygiene or health of occupants or neighbours, among others by giving-off of toxic gas, or by presence of dangerous particles or gases in the air. CPR specifies that any construction work must not pose any harm to hygiene or health of occupants or neighbors….by giving-off of toxic gas, or by presence of dangerous particles or gases in the air and it must “eliminate or limit the use of materials which may release pollutants, and the use of which results in concentrations greater than acceptable limits”.
Actual interpretation of this requirement is currently left in the hands of individual EU Member States. France and Germany have already taken steps to act on this initiative. Both are imposing new requirements for mandatory testing and labelling of Volatile Organic Compound (VOC) emissions from construction products. VOCs are emitted by a wide range of substances used in the manufacture of flooring and plywood such as solvents, additives, and plasticizers.
In Germany, all construction products placed on the market must bear a “U Mark” indicating conformance to mimimum health standards including VOC emissions. The requirement has applied to resilient, textile and laminate florr coverings since 2005, to parquet and wood flooring since 2011, and to parquet adhesives ahnd coatings since 1/1/2012.
In France, a regulation was published on 25 March 2011 setting out requirements for mandatory testing and labelling of VOC emissions on a wide range of construction products. These include walls, ceiling, floor coverings and coatings; room partition and suspended ceiling panels; insulation products; and doors and windows. The regulation required that from 1/1/2012, any regulated product placed on the French market must be labelled with VOC emission classes.
PDF of this article:
Copyright ITTO 2020 – All rights reserved