

World production of furniture was worth about US$ 437 billion in 2013 (in current dollars at producer prices), doubling the value in the last decade. This estimate is drawn from the CSIL World Furniture Outlook 2014 report covering the 70 most important furniture producing countries. CSIL is an international furniture research organisation based in Milan, Italy, which also publishes the online World Furniture journal (www.worldfurnitureonline.com).
CSIL observe that while world growth in furniture production slowed during the financial crisis, it continued year on year. All the main demand drivers registered a positive trend at global level including growth in urban population, income availability and investment in construction.
Growth in world furniture trade was interrupted in 2009 when it declined 19% to US$ 94 billion. However trade rebounded to US$ 106 billion in 2010 and reached the pre-recession level of US$ 117 billion in 2011. Since then world trade has continued to grow and is estimated by CSIL to have reached US$ 124 billion in 2013. CSIL forecast further growth in 2014 to US$ 128 billion. Over the last 10 years, furniture has consistently accounted for about 1% of total trade of manufactured products.
The financial crises combined with rising China’s domestic market have led to a decline in global furniture import penetration (measured as the ratio between imports and consumption) in recent years. Import penetration increased from 27.8% to a peak of 30.6% between 2003 and 2007 but then decreased between 2007 and 2009 and has remained below the pre-recession maximum ever since.
According to CSIL, in 2013 the leading importers of furniture were the United States, Germany, France, the United Kingdom and Canada. The major exporters were China, Germany, Italy, Poland and the United States. All major furniture importing countries recorded decreases in furniture import flows during the financial crises. By 2013, the USA and Canada had reached or exceeded the prerecession level, while recovery has been slow in Europe.
CSIL forecast that global furniture consumption will rise by around 3.3% in 2014, with most growth concentrated in emerging markets. CSIL expect extremely limited growth in Western Europe of only around 0.5% this year. Growth in furniture consumption will be higher, but still constrained, in Eastern Europe/Russia (2.4%), North America (2%) and South America (2.75%). The highest rates of growth are expected to be in the Middle East and Africa (3.9%) and the Asia-Pacific region (5.2%).
CSIL note that while growth rates have been much higher in emerging markets, in 2014 consumers in high income countries still spent on average five times more than consumers in middle and low income countries for furniture purchases. Nevertheless current trends indicate that the geography of furniture consumption is gradually changing and that interaction between high income and emerging countries is increasing.
CSIL comment that in addition to the changing global map of furniture production and consumption, other factors influencing the sector include: energy saving and environmental protection; better use of raw materials; information and automation technology; and the increasing importance of standardization.
Upward turn in EU furniture production
The latest Eurostat data indicates that total EU furniture production in the first quarter of 2014 was running at around 95% of the level recorded in 2010 (Chart 1). This is a slight improvement compared to the previous 3 quarters when production was at around 93% of the 2010 level. The upturn is the first quarter-on-quarter rise in overall European furniture production recorded for over two years.
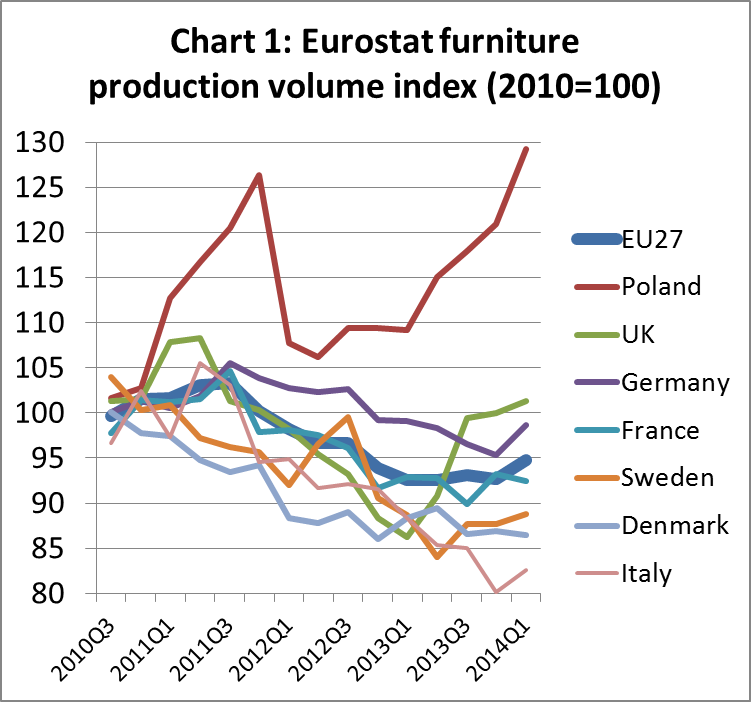
The recent rise in EU furniture production was driven primarily by trends in Italy, Germany and Poland, the three largest furniture producing countries in Europe.
In Italy, the sharp decline in furniture production which began during the country’s political and financial crises in 2011, hit bottom in the last quarter of 2013 and rebounded slightly in the opening months of 2014. Italian furniture exports have been rising gradually, backed by a concerted effort to improve international competitiveness and marketing. Italy’s domestic furniture market has been very weak but there are now some signs of improvement. The contraction in Italian construction that has characterised the past six years seems to have slowed. Activity in this sector has been boosted by tax concessions of 65% for energy-saving and 50% for refurbishment measures.
Furniture production in Germany was also declining in 2013, but rebounded slightly in the first quarter of 2014. Data provided to CSIL by HDH (Confederation of German Woodworking and Furniture Industry) indicates that in 2013 German furniture industry turnover declined 3.7% and the number of furniture companies in Germany fell by 0.5%. However Germany remains a leading furniture producer with over €16 billion turnover. Germany has struggled in the face of rising competition from Poland and China and as a result exports have remained flat or declined over recent months. However robust construction activity in Germany has boosted domestic demand for furniture, notably in the kitchen sector.
The value of furniture production in Poland has risen by about 25% since the first half of 2012. The country has benefited from significant inward investment in furniture manufacturing in the last two years, particularly by branded companies located in western European countries where labour and other costs tend to be higher. Poland benefits from its strong strategic location, a member of the EU with relatively large domestic market and close to Germany and other significant markets in central and Eastern Europe and Scandinavia. Polish furniture exports have been rising over the last two years despite uncertain economic conditions in Europe. The value of Poland’s currency, the zloty, has remained relatively stable and low compared to the euro, helping boost export competitiveness.
Poland’s domestic market is also one of the fastest growing in Europe as record-low borrowing costs in the country have revived investment and consumer spending. The European Commission predicts that Poland’s GDP will rise 3.2% in 2014 and a further 3.4% in 2015 after last year’s 1.6% expansion. This is expected to encourage even more investment in Polish furniture manufacturing. In May this year, Poland’s Deputy Prime Minister and Economy Minister Janusz Piechociński said that the Swedish furniture group IKEA had committed to investment of €1 billion annually in new production plants in the country.
EU wood furniture trade analysis
The remainder of this report contains a review of the most recently available EU wood furniture trade data to end April 2014. EU external trade in wood furniture is relatively small compared to total consumption, which is about €50 billion per year (or €4200 million per month). However in recent years, globalisation trends have made external trade more relevant as there has been more import penetration into the EU market, particularly by Asian manufacturers. Meanwhile, with consumption static in domestic markets, European furniture companies have also been seeking to increase sales in other parts of the world.
Seasonal fluctuations are a major feature of the EU furniture trade. EU wood furniture exports are almost exclusively interior products, mainly destined for other western countries, which tend to rise sharply at the end of the year in the run-up to the Christmas holiday season. In contrast, EU imports of wood furniture tend to be higher in the opening months of the year. This is partly because they contain a high proportion of exterior products mainly imported from Asian countries in the spring months. In addition, a relatively large proportion of the Asian furniture imported into the EU is bought during the January sales season.
The following analysis of EU furniture trade uses “12 month rolling average” data. This is calculated for every month by averaging the monthly imports or exports for the previous twelve months. The data irons out seasonal variations so that potentially significant long term changes can be more easily identified. It focuses particularly on apparent changes in the relative competitiveness of wood furniture supplying countries into the EU.
Rise in EU wood furniture trade surplus
Chart 2 shows the trend in EU trade balance of wood furniture using 12 month rolling average data between January 2010 and April 2014. It highlights the strong growth in EU exports of wood furniture over the last 3 years. This is driven by growing consumption in emerging markets and declining demand in domestic markets which forced European manufacturers to diversify sales into other areas of the world.
The trend in EU imports of wood furniture over the last three years has been less consistent. Imports were rising in 2010, particularly from China which increased market share at a time when there was a considerable emphasis on price amongst European consumers. However the trend in imports since then has been generally downwards. This is due to the combined effects of overall weak consumption in Europe, rising labour and other costs in Asian manufacturing, volatile freight rates, improving competitiveness of European manufacturers, and possibly also regulatory issues such as the EU Timber Regulation introduced in March 2013.
Between January 2011 and April 2014, the EU trade surplus in wood furniture with the rest of the world increased, rising consistently from negligible levels to around €300 million per month (based on 12 month rolling average data).
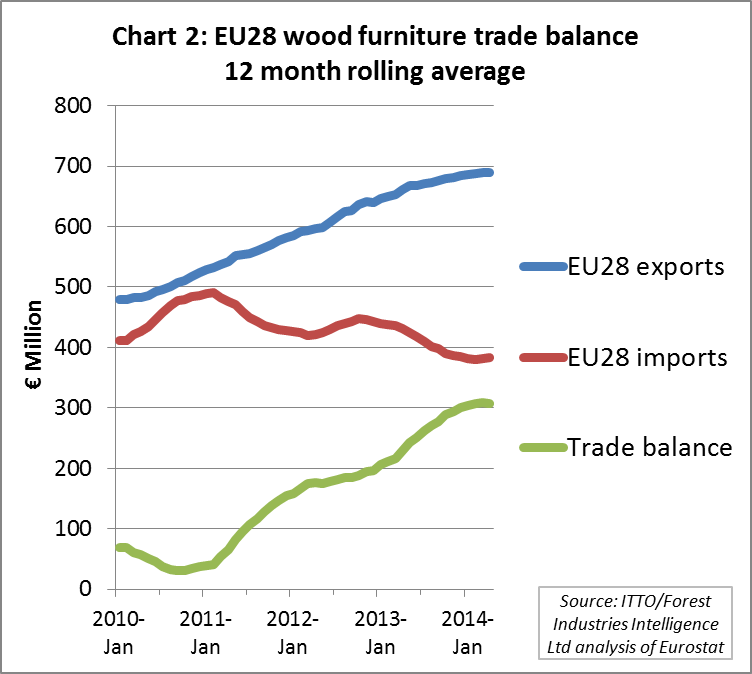
There are early signs this year that the pace of growth in the trade surplus may be slowing, as both the rise in exports and fall in imports levelled off in the first quarter of 2014. This is probably due to the recent improvement in domestic European demand, particularly in the UK which is the main destination for wood furniture imported into the EU.

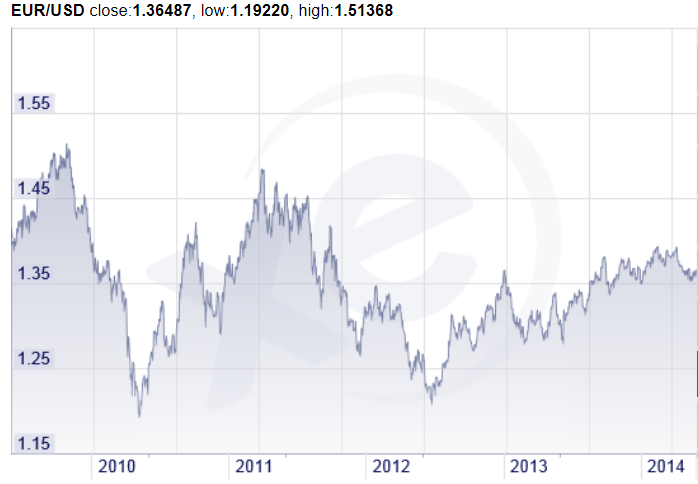
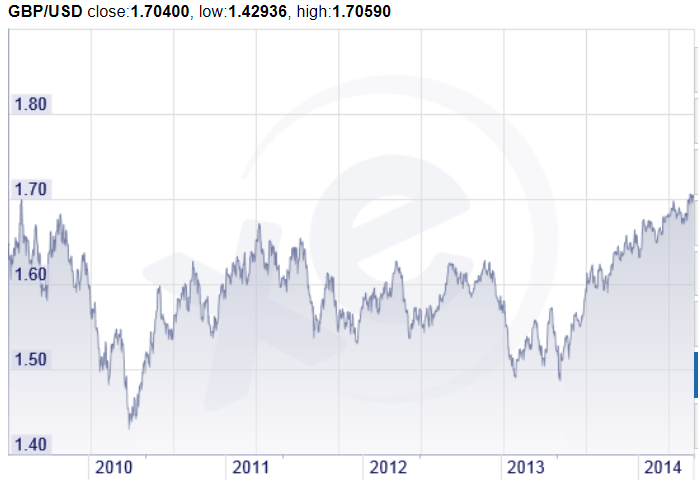
Fig1 – USD to 1 Euro, 5 year trend (Source: www.xw.com) Fig2 – USD to 1 GBP, 5 year trend (Source: www.xe.com)
Exchange rate trends
A review of European currency exchange rates (see figures 1 and 2) suggests these have played a role to influence short and medium-term trends in the EU wood furniture trade balance. The two-year cycle of upward and downward fluctuation evident in EU import data is quite strongly correlated with changes in the dollar-euro rate and to a lesser extent with the more stable dollar-GBP rate. The rising relative strength of European currencies was probably a factor encouraging greater imports of wood furniture during 2010 and the second half of 2012. The relative strength of the euro is also likely to be a factor contributing to the recent slowdown in pace of growth of the trade surplus.
However, exchange rates have not been a significant driver of the overall increase in EU wood furniture trade surplus over the last 4 years. This is clear from the consistency of the increase in trade surplus during a period when exchange rates have passed through several upward and downward cycles.
Wood furniture imports fall relative to non-wood furniture
Analysis of furniture trade trends by material type using 12 month rolling average data suggests that EU domestic manufacturers are generally becoming more competitive relative to imports in supply of wood and, to a lesser extent, metal furniture. However, import penetration into the EU appears to be growing in the smaller market segment for plastic furniture.
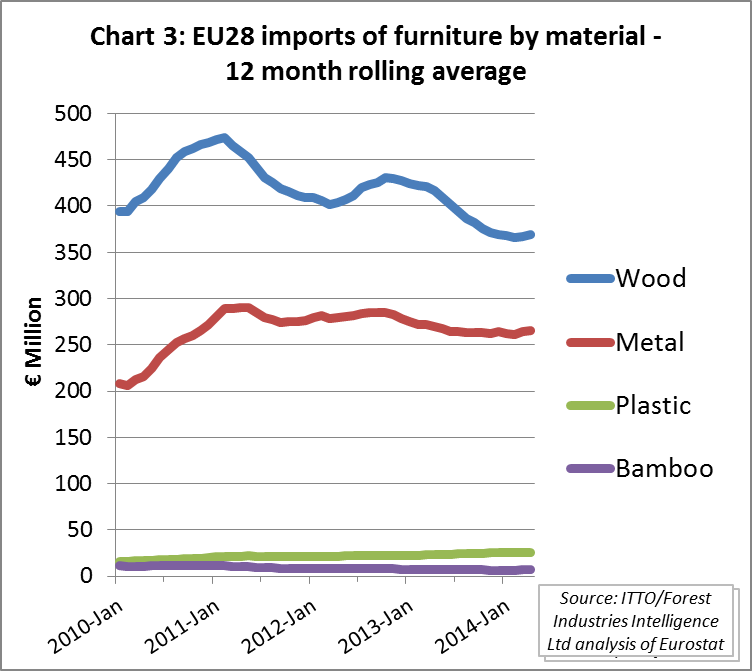
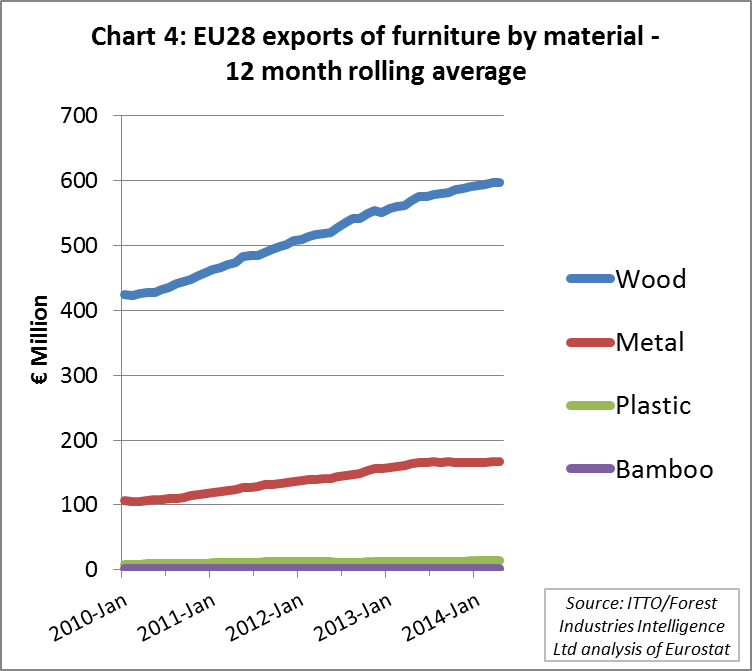
Chart 3 shows the trend in EU imports of furniture by material type between January 2010 and April 2014. EU imports of wood furniture have generally been declining since the start of 2011. In contrast, imports of metal furniture reached a peak in January 2011 and remained quite stable until around the middle of 2012 when they started to slow gradually. Meanwhile imports of plastic furniture have been rising consistently over the last 4 years, although from a relatively small base. Over this period, the share in furniture imports of wood has fallen from 63% to 55%, while the share of metals has risen from 33% to 40% and of plastics from 2.5% to 3.8%. EU imports of bamboo, rattan and similar furniture remain negligible.
Chart 4 shows the trend in EU exports of furniture by material type using 12 month rolling average data between January 2010 and April 2014. During this period, EU exports of metal furniture have risen alongside exports of wood furniture. The EU exports only negligible amounts of plastic and bamboo furniture. Between January 2010 and April 2014, the share in EU furniture exports of wood has fallen slightly from 78% to 77%, while the share of metals has increased from 20% to 21% and of plastics from 1.6% to 1.8%.
Overall these trends indicate that while wood remains the dominant material in the EU furniture market there has been a partial switch towards more use of metal and plastic. It is possible that some EU furniture retailers are switching away from wood in imported products due to the greater regulatory control through EUTR relative to other materials. However the fact that metals also now make up a larger share of EU exports suggests fashion and other commercial factors are also at play.
European fashion in wood furniture is strongly towards oak and other domestic species, a trend much encouraged by EU manufacturers to increase their own competitiveness relative to imported products. Fashions are also generally towards a greater mix of materials in furniture. The rise of plastic on the margins is an indication of the widely reported move towards this material in the garden furniture sector, partly in response to lack of availability and higher prices of quality tropical hardwoods like teak.
Mixed fortunes for Asian suppliers to the EU
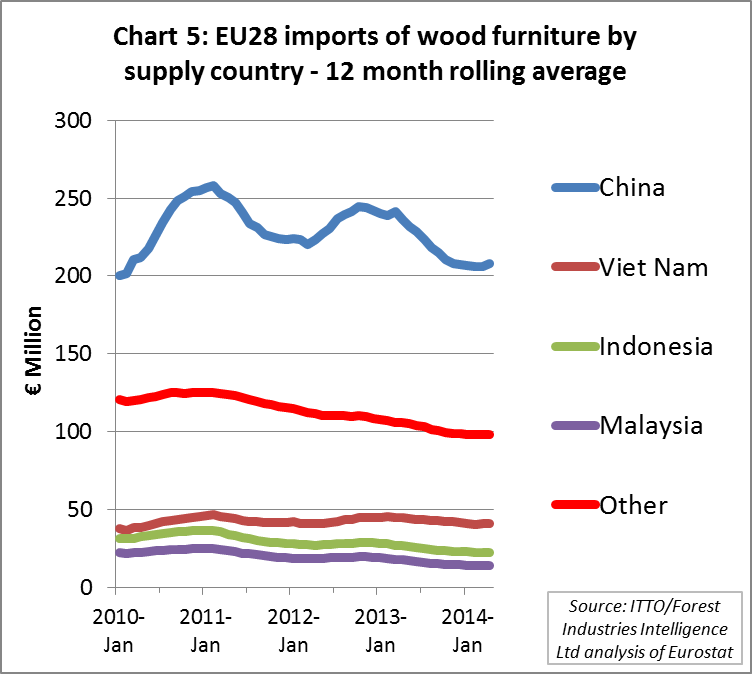
Chart 5 shows the trend in EU imports of wood furniture by supply country using 12 month rolling average data between January 2010 and April 2014. After peaking at the end of 2010, the overall trend in imports from China has been downward during the last three years. However, because imports from other countries have fallen more quickly, China’s share in overall EU wood furniture imports has risen from 49% to 54% since the start of 2010. Imports from Vietnam have remained relatively stable since the start of 2010 and as a result share from this country has risen from 9% to 11%. Share of imports has fallen from Indonesia (8% to 6%) and Malaysia (5% to 4%) during the same period.
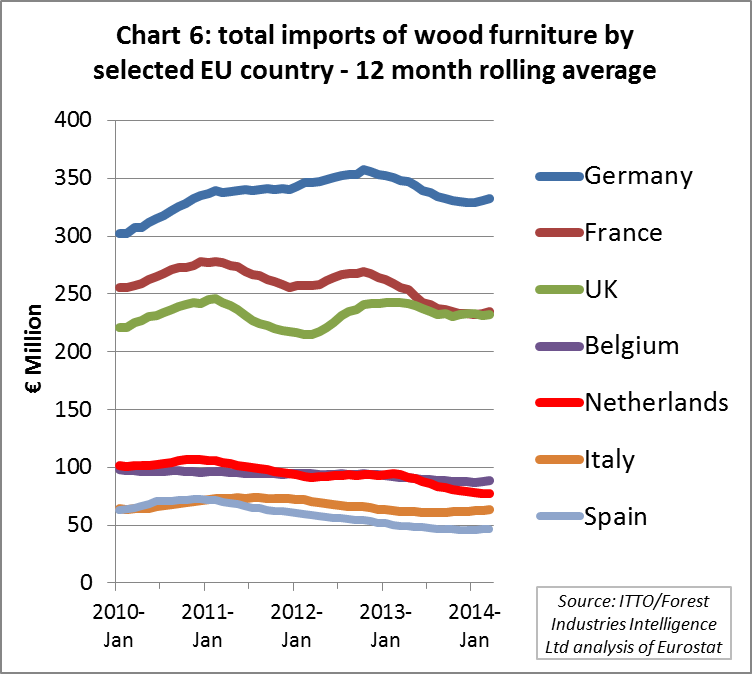
Chart 6 shows the trend between January 2010 and April 2014 in all imports of wood furniture (from both within and outside the EU) by EU Member State using 12 month rolling average data. It shows that European markets have followed different paths over the last 4 years, although the general trend is downwards, at least since the start of 2013.
Imports into Germany, which was less affected by the financial crises, were rising consistently until the end of 2012, but have since slowed significantly. Imports into the UK and France, have fluctuated more widely over the short-term, to some extent driven by exchange rate movements. In the case of the UK the overall 4 year trend has been fairly stable. In contrast, imports into France have been declining quite sharply since the start of 2013. Imports into the Netherlands, Belgium, Spain and Italy have also been falling over the last two years.
Falling imports of Chinese furniture by smaller European markets
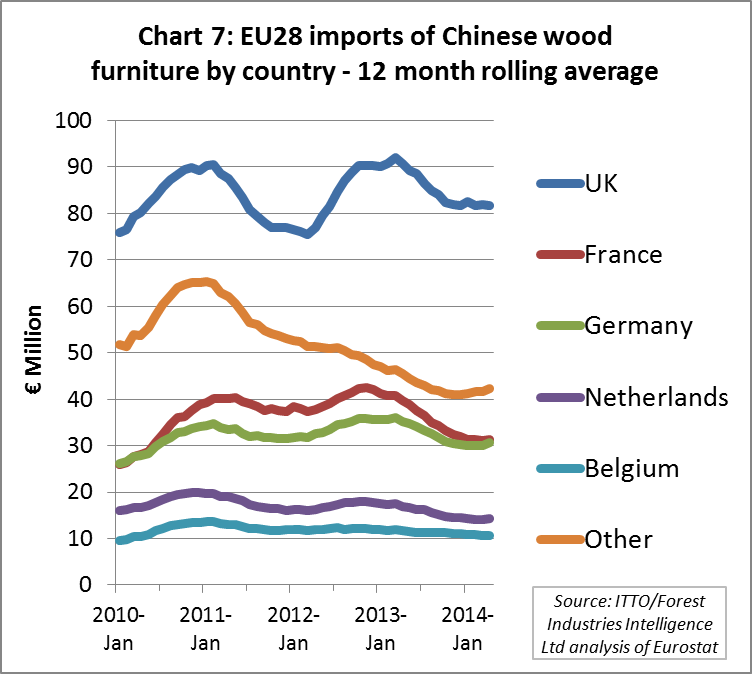
Chart 7 shows the trend between January 2010 and April 2014 in EU imports of Chinese wood furniture by EU Member States using 12 month rolling average data. It highlights that these imports are particularly susceptible to cyclical changes, to some extent driven by exchange rate movements. Chart 7 shows that the main decline in EU imports of Chinese wood furniture over the last 4 years has been in “other” markets and that China’s trade with the largest EU importing countries – UK, France, Germany, Netherlands, and Belgium – has remained more consistent. Chart 7 also provides an early an indication that after the sharp decline in EU imports of Chinese wood furniture during 2013, imports have been more consistent and maybe turning upwards again in 2014.
Rising EU furniture exports to all destination regions
Chart 8 shows the trend between January 2010 and April 2014 in EU exports of wood furniture to non-EU countries by destination region using 12 month rolling average data. It highlights that exports increased to all global regions except Africa between 2010 and 2012. It also shows that the slowdown in growth of EU wood exports from the second half of 2013 onwards was concentrated in other European countries and Russia. EU exports to China, other parts of Asia and North America have continued to rise.
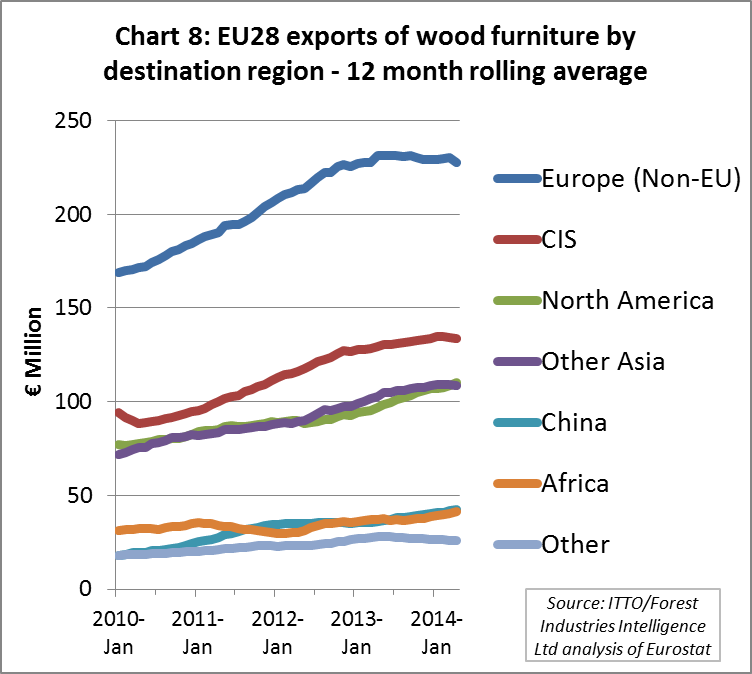
Nevertheless, the majority of EU wood furniture exports are still destined for neighbouring European countries and Russia. Despite the slowdown in growth, the outlook in these countries appears reasonably good. European economies are generally improving. In Russia, the domestic furniture industry sector is quite small and uncompetitive relative to imports. Exporters of furniture to Russia are benefitting from reduced tariffs since Russia’s entrance into the WTO in 2012. There are also positive trends in Russia’s construction market, the State Construction Committee having been tasked with increasing residential floor space by 142 million square feet by 2020.
German exports slide while Italian and Polish exports rise
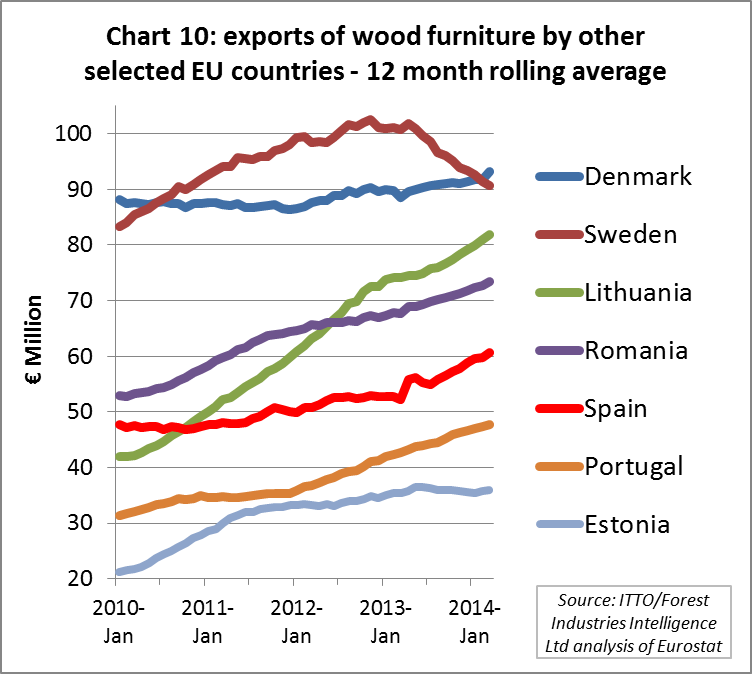
Charts 9 and 10 show the trend between January 2010 and April 2014 in exports of wood furniture (both within and outside the EU) by EU Member States using 12 month rolling average data.
Italy maintains its position as the largest EU export of wood furniture and Italian exports have been rising consistently over the last 4 years. The Italian furniture industry has undergone a major process of acquisitions and closures in recent years. The remaining companies have focused heavily on cost reduction through use of technology and on export market development, building on strong brands and design knowledge. The Italian furniture sector is trying to maximise the marketing potential of an industry which, despite recent consolidation, is still dominated by smaller enterprises. One way of achieving this is through development of marketing co-operatives. These co-operatives co-ordinate participation in trade shows, undertake joint R&D projects, and jointly communicate “Made in Italy” supply chains certified using ISO9001 and based on wood derived from FSC and PEFC certified forests.
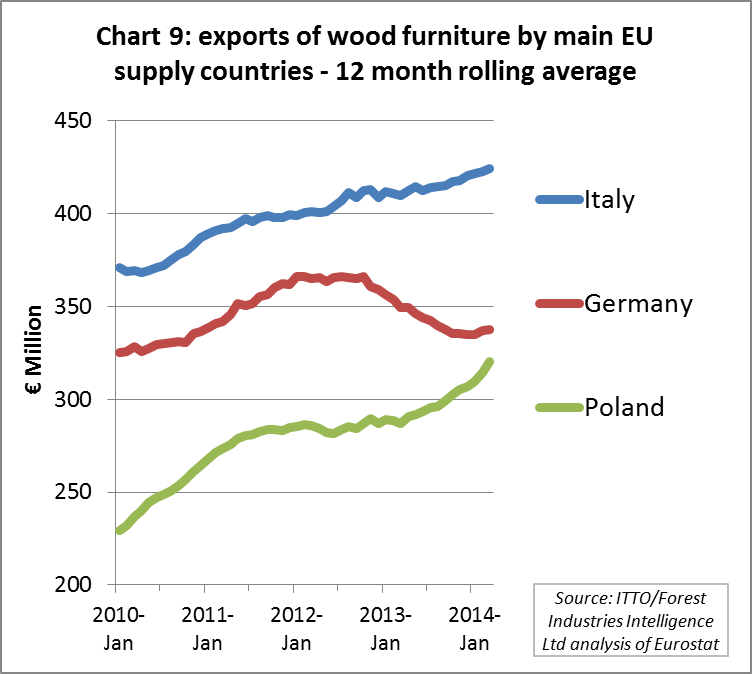
Exports from Germany, the second largest exporter, were rising strongly until the beginning of 2012, but then fell during 2013 under pressure from the strong euro value and overseas competition, particularly from neighbouring Poland. However, German wood furniture exports are showing signs of revival this year.
Meanwhile exports of wood furniture from Poland have been surging since early 2013. In addition to Poland, several other Eastern European countries are currently benefitting from a rise in inward investment and are emerging as more important exporters of wood furniture this year, notably Lithuania, Romania and Estonia.
Sweden was the fourth largest EU exporter of wood furniture until the start of this year, but a recent downward turn in trade means that this position is now threatened by Denmark which has been slowly recovering ground. Nevertheless, Sweden’s furniture industry remains a major force having grown 24% in the last ten years. IKEA is a major influence in Sweden’s furniture market – the company turnover for 2013 was €27.9 billion euro – and the recent downturn in exports may be partly explained by IKEA shifting some processing to Eastern Europe. Sweden’s furniture sector also comprises numerous SMEs, mainly concentrated in the south of the country where there is good access to forest resources.
Another notable trend is a gradual increase in wood furniture exports by Spain and Portugal. Both countries have a strong tradition in wood furniture manufacturing but relied heavily on domestic demand prior to the recession. With domestic markets weak, both countries have sought to become more involved in exports in recent years, apparently with some success. This is in contrast to France and Belgium (not shown on the Charts) where wood furniture exports have been declining over the last four years.
PDF of this article:
Copyright ITTO 2020 – All rights reserved