

The total value of EU imports of wood products was €17.20 billion in 2015, 12% more than in 2014. This followed an increase of 10% to €15.3 billion in 2014. In 2015 EU import value was at the highest level since 2008 just before the global financial crises (Chart 1).
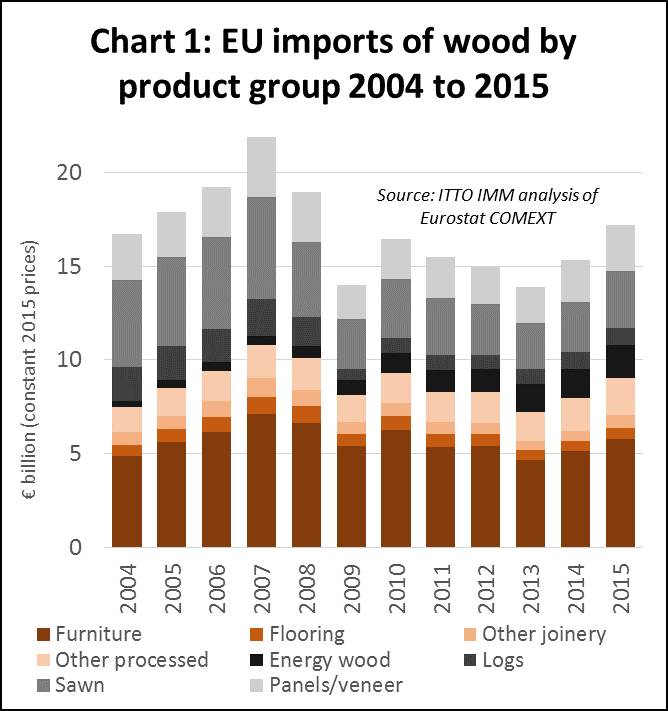
The surge in the euro value of imports in 2015 was partly owing to the weakness of the euro which on average was valued around 20% less against the dollar in 2015 compared to 2014. This meant that euro import prices for most products from the Americas and Asia increased. Import volumes also increased across most wood product groups in 2015 but to a lesser extent than € value.
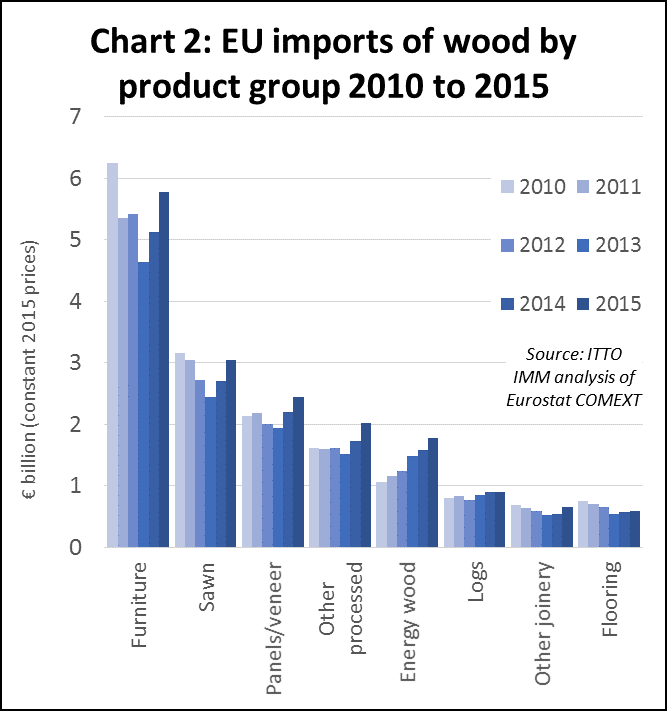
The € value of imports increased across all wood product groups in both 2014 and 2015 (Chart 2). Imports of wood furniture, which had been declining to 2013, rebounded 10% in 2014 and 13% in 2015 to reach €5.78 billion. Imports of sawn wood rebounded from a low in 2013, rising 10% in 2014 and 12% in 2015 to reach €3.04. Similarly imports of panels (mainly plywood) increased 13% in 2014 and 11% in 2015 to reach €2.44 billion. The long term rise in imports of energy wood continued in 2015 to reach an all-time high of €900 million. Imports of other joinery products (mainly doors and LVL for window frames) were flat in 2014 but increased 22% to €658 million in 2015. Imports of wood flooring increased 5% in both 2014 and 2015 to reach €595 million. Imports of other processed products increased 14% in 2014 and a further 17% in 2015 to €2.02 billion.
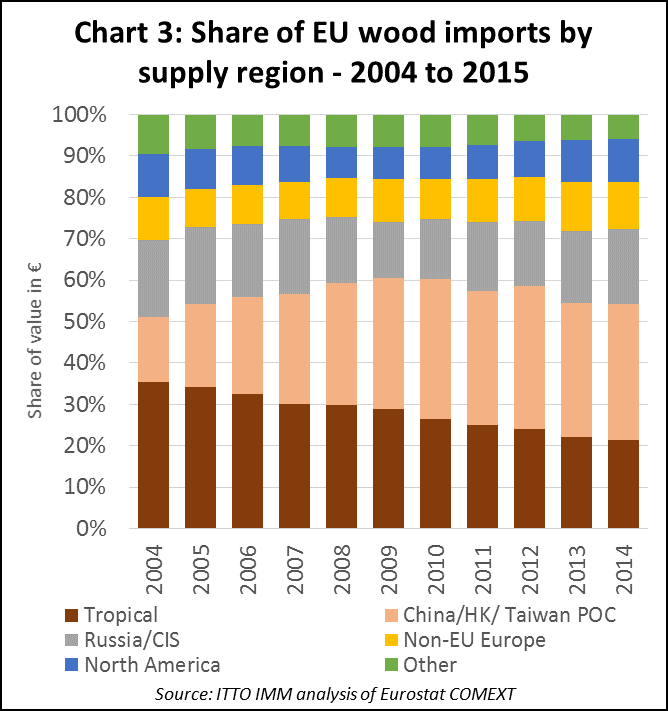
Total imports of wood products from tropical countries increased 15% from €3.28 billion in 2014 to €3.78 billion in 2015. This followed a 6% increase between 2013 and 2014. In terms of share of overall EU imports, 2015 was notable for registering the first reversal in the fortunes of tropical countries in the last decade. The share of tropical countries in total EU wood product import value fell continuously from 35% in 2004 to a low of 21.4% in 2014, before rebounding slightly to 22.0% in 2015. Tropical countries lost share initially to China in the period 2009 to 2010, and then to North American, Russian and non-EU European countries in the period 2011 to 2014. However in 2015, tropical countries regained a little share in import value mainly at the expense of Russia and non-EU European countries. China’s share in EU imports remained stable at 32.7% in both 2014 and 2015 (Chart 3).
The recovery in EU imports of tropical wood products in 2014 and 2015 was particularly pronounced for furniture and sawn wood, although there were more minor gains for all other product groups (Chart 4). EU imports of wood furniture from tropical countries increased 11% to €1.33 billion in 2014 and by a further 16% to €1.55 billion in 2015. Imports of sawn wood from tropical countries increased 7% to €0.87 billion in 2014 and by a further 16% to €1.02 billion in 2015. Imports of plywood and veneer from tropical countries increased more slowly, by 1.4% to 371 million in 2014 and by 6% to €394 million in 2015.
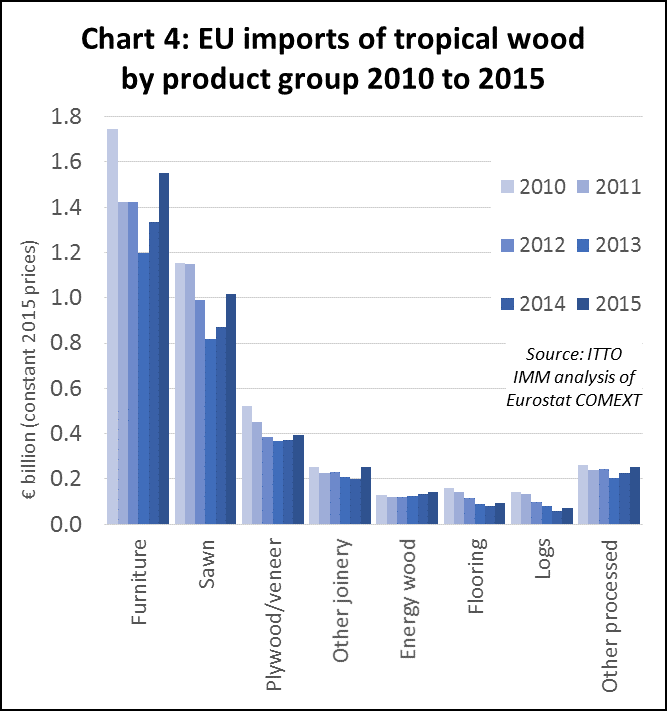
The long-term shift in EU tropical wood imports away from primary and secondary wood products in favour of tertiary products continued in 2014 and 2015. The value of tertiary processed tropical wood products imported by the EU increased from 55% of total import value in 2013 to 57% in 2015.
Rising EU trade surplus in wood products
The relative weakness of EU currencies, combined with a strong focus on reducing costs and improving efficiency in the European wood sector and the slow growth of domestic consumption, contributed to a sharp rise in EU exports of wood products to non-EU countries between 2009 and 2015 (Chart 5).
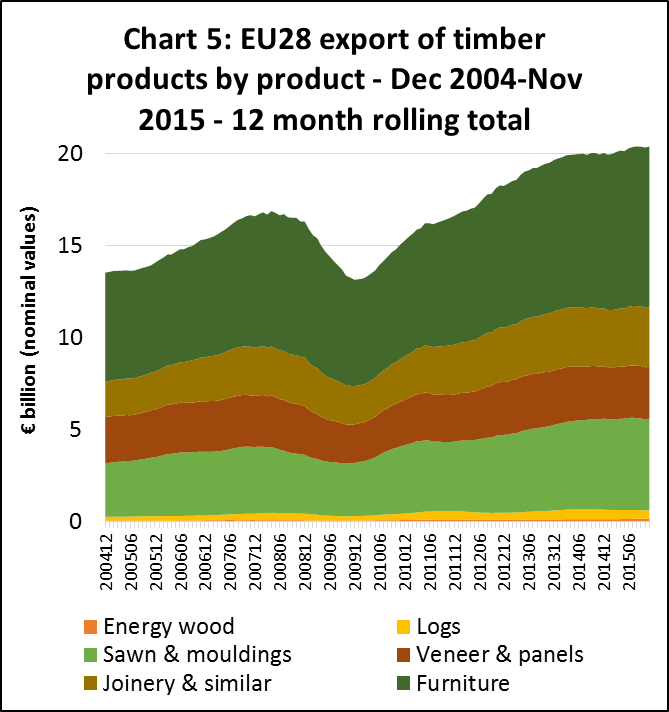
In 2015, the value of EU exports of wood products were running at their highest ever level at over €20 billion. In 2015, the EU had a €3 billion trade surplus in wood products which compares to a €3 billion deficit before the financial crises. EU export growth has been concentrated in sawn wood, joinery (notably flooring and glulam products) and wood furniture. Although around 30% of EU wood product exports consistently go to neighbouring European countries (mainly Switzerland and Norway), since the global financial crises there has been a significant in rise in exports to Africa, the Middle East and China alongside traditional markets in North America and the CIS.
For wood exporters selling into the EU, the weakness of the euro and sharp rise in the EU’s wood trade surplus imply intense competition from domestically harvested timber and manufactured wood products. Due to the wide diversity of wood manufacturing activities in the EU, this is true of nearly all wood sectors. Even in those wood sectors where European manufacturers have traditionally been weak and more dependent on imports, such as in supply of durable goods for outdoor use and in appearance grade wood, new innovative products are taking share from external suppliers. Key innovations include a wide range of new surface finishes to enhance the appearance and performance of panel products, and thermal and chemical modification processes to enhance the durability of domestic wood species.
At the same time, with traditional markets growing only slowly, EU wood manufacturers are developing new products designed to extend the range of wood into new sectors traditionally dominated by other materials, notably steel and concrete. For example, EU production of cross-laminated timber – a product which can successfully compete with steel and concrete in high-density urban construction – increased from 100,000 m3 in 2005 to 700,000 m3 in 2015.
Legality verification and certification in EU wood supply
Just how much of the wood traded internationally derives from legal and sustainable sources is a question frequently asked by both timber buyers and policy-makers in the EU. The question has become particularly relevant now that the EU Timber Regulation obliges all importers to demonstrate that there is a negligible risk of any illegal wood entering their supply chains. Unfortunately there is not a simple answer to this question.
One issue is how to define terms like “negligible risk” and “sustainably” sourced. There are large areas of forest around the world where there is very little risk of illegal harvest and that would be considered “sustainable” against most measures, but are not independently verified or certified. This is particularly true of forests owned and managed by communities or private non-industrial forest owners.
Another issue is that certification systems do not measure the volume of trade in certified products. Typically they only monitor the area of certified forest and the numbers of chain of custody certificates issued.
Nevertheless, efforts have being made to overcome these problems. In 2012, Forest Industries Intelligence (FII) Ltd, a UK-based company, devised a procedure to estimate “level of exposure to 3rd party verified/certified wood”. This formed part of a project joint funded by the UK Department for International Development (DFID), the EU Timber Trade Action Plan, and European Timber Trade Federation (ETTF). That 2012 assessment has now been updated by the ITTO Independent Market Monitoring (IMM) Project which is monitoring the market impact of the FLEGT Voluntary Partnership Agreements (VPAs).
The ‘level of exposure’ is a rough measure to identify gaps in forest coverage of independent certification and legality verification systems. It is based on the percentage area of certified or legally verified commercial forest area in each individual supplier country. For example, if 40% of its forest area is known to be independently certified or legally verified, the level of exposure of a country’s wood production and exports is also assumed to be 40%. The certified/verified forest areas are calculated by comparing data from the various certification and verification systems with UN FAO figures for areas of productive forest land.
‘Level of exposure’ data can be broken down by verification system, including FSC, PEFC, or operator-based systems of legality verification (such as SGS TLTV, Smartwood VLO, or OLB). For this assessment, wood from countries covered by FSC-endorsed National Controlled Wood Risk Assessment is also considered ‘3rd party verified’. To avoid double counting, areas dual certified to FSC and PEFC are accounted separately. Adjustments are also made for a few countries, such as Brazil and the USA, where there is a big difference in the level of certification in hardwood and softwood forests.
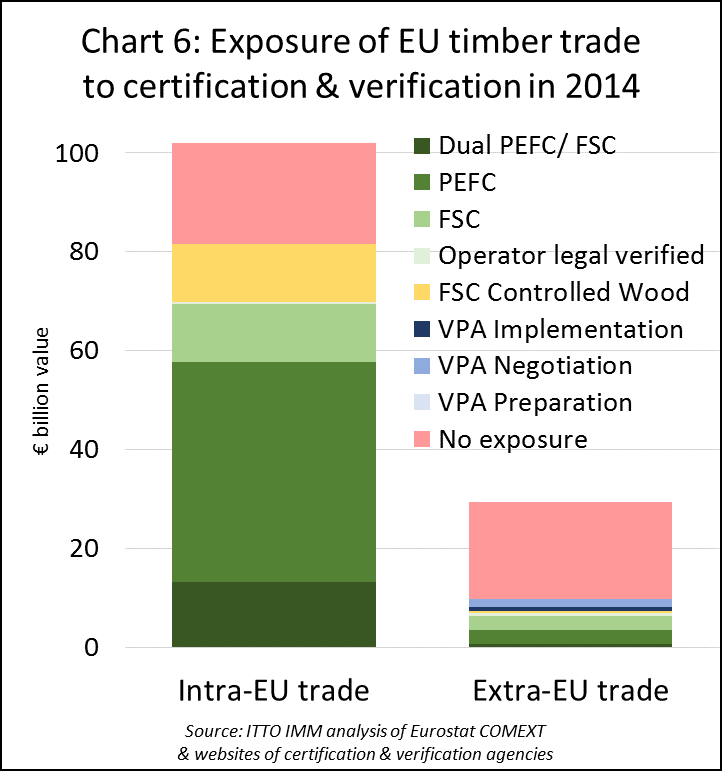
The new assessment indicates that in 2014, around 80% of internal EU trade in timber products (including all wood, wood furniture, pulp and paper) was “exposed” to some form of certification or legality verification. This is simply due to the fact that a very large proportion of forest area within the EU is either certified or assessed to be low risk of illegal harvest in an FSC national controlled wood assessment (Chart 6).
Limited access to certification for wood imported from outside EU
In contrast to intra-EU trade, level of exposure to some form of certification or legality verification of all EU timber products imports from outside the EU was only around 25% in 2014. While low, this figure is heading in the right direction, rising from 19% in 2007. The assessment also indicates that if all timber from the 17 countries that are now engaged in FLEGT VPAs had been licensed in 2014, the level of exposure to legally verified timber in EU external trade would have been 8% higher, at 33%. The increase due to VPA countries excludes areas already certified or legally verified in these countries (notably by SVLK in Indonesia, PEFC/MTCS in Malaysia and FSC in Central Africa) which are already included in the 25% figure.
Obviously that leaves a large proportion of imports which are unlikely to be from third party certified or legally verified sources. Chart 7 shows that China dominates amongst EU-supplying countries with low exposure to verified timber. China’s level of exposure to certification is set to increase significantly. The 2014 data does not include figures for the China Forest Certification System (CFCS) which was endorsed by PEFC in February 2014 but had yet to register any PEFC-certified forest at the end of that year. By the end of 2015, 5.6 million hectares were registered as PEFC certified in China and more recent reports from the China State Forestry Administration indicate that around 10 million hectares of forest are now certified – although most of that area is natural protection forest and China’s large area of production plantation forest is still largely uncertified.
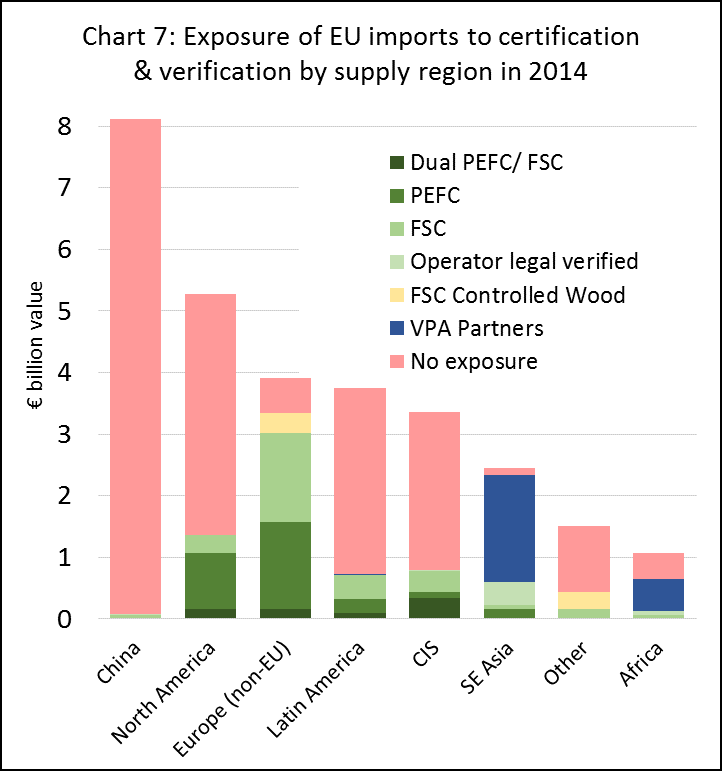
North America is identified as another region with “low exposure” to legality verification and certification. Most commercial forest land in Canada is certified. In contrast, the U.S. has a large area of private non-industrial forest land which is not certified. The US government also has a long-standing policy commitment not to pursue certification of federal forest lands.
Latin America is assessed to have relatively low level of exposure to certification and verification. However this figure is severely distorted by reliance on forest area to calculate the index. The Amazonian rain forest is, of course, huge and only a tiny proportion is certified. But this area only contributes a relatively small volume of timber to international trade. Most of wood product imported into the EU from Brazil now constitutes softwood or eucalyptus from plantations outside the tropical zone, many of which are certified. Therefore the index probably underestimates the real level of exposure of Latin American wood products in trade.
While the VPA process captures only a relatively small proportion of total EU imports of timber and timber products, it is very significant amongst tropical supplying countries in South East Asia and Africa. If all timber products imported by the EU from VPA countries were FLEGT licensed, the level of exposure to verified timber from Southeast Asia would rise from 25% to 95% and from Africa from 11% to 60%.
PDF of this article:
Copyright ITTO 2020 – All rights reserved