

EU imports of tropical veneers increased by 7% to 257,700m3 in the first 11 months of 2015, with growth driven primarily by rising trade between Gabon and France. Growth in volume was matched by a 6% increase in value to €162 million.
EU imports from Gabon increased 13% to 126,300m3 during the first 11 months of 2015. Since okoumé log exports were banned by Gabon in 2010, the southern European okoume plywood sector – now much diminished – relies more heavily on imports of veneer.
Demand for okoumé plywood has picked up in Europe in 2015 due primarily to recovery in the Netherlands building industry and slow improvement in the French market. The French company Rougier which produces okoumé veneers and plywood in France and Gabon, booked an 11.8% increase in revenues in its European business during the first nine months of 2015 and reports an improved economic climate in Europe.
In addition to Gabon, EU imports of tropical veneer also increased during the first 11 months of 2015 from Cameroon (+16% to 27,100 m3), Congo (+2% to 14,500 m3), and Ghana (+22% to 8,600 m3). However imports from Ivory Coast declined 3% to 60,800 m3. (Chart 1).
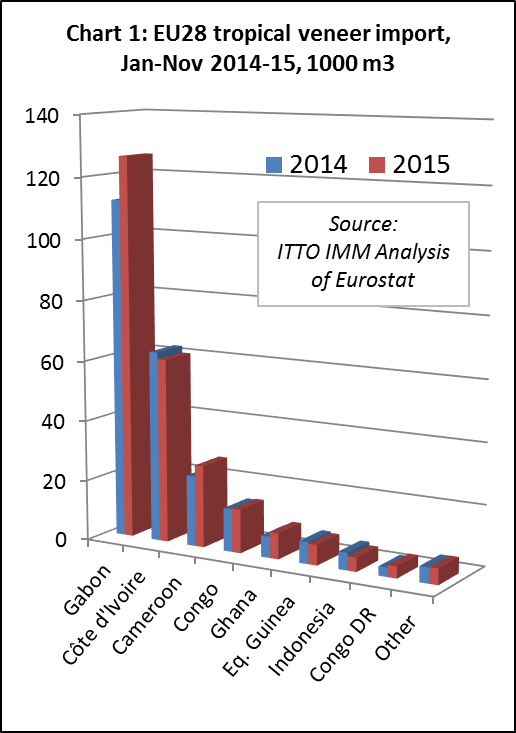
Imports into France and Italy, now the largest EU markets for tropical veneer, both registered double-digit increases between January and November 2015, rising 14% to 104,791m3 and 16% to 60,737m3, respectively. There were also significant increases in imports by Greece (+25% to 14,467 m3) and Romania (+43% to 14,034 m3).
Of the five largest EU markets for tropical veneer, Spain (-16% to 32,411m3) was the only to report declining imports in the first 11 months of 2015. However imports also declined into Germany (-17% to 12893 m3) and Belgium (-47% to 6343 m3) during the period. The German veneer association IFN concluded during its annual meeting in June 2015 that veneers were increasingly becoming a niche product in the German market – a startling conclusion in a country which little more than a decade ago was at the very centre of the global veneer industry.
EU tropical plywood imports remain static in 2015
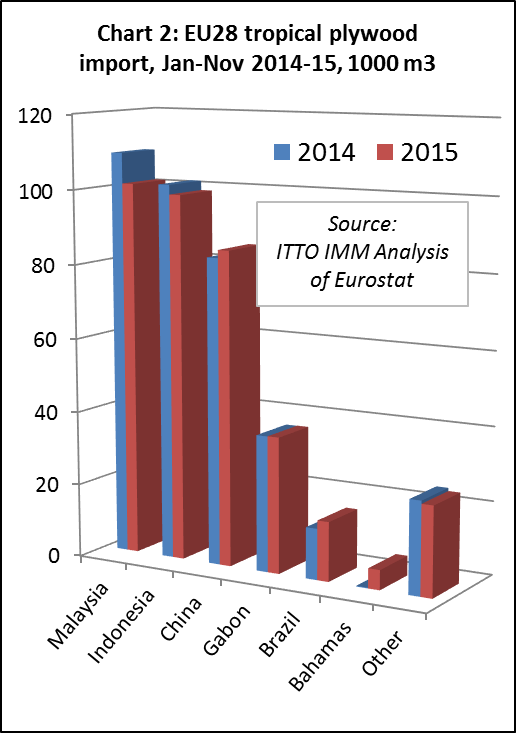
The EU imported 367,000 m3 of tropical plywood in the first 11 month of 2015, the same as in the previous year. However there was growth in EU import value of plywood (+8.7% to €194.1 million) during the period as import prices were higher in 2015 due to the weak euro. The euro was on average 16% down on the dollar in 2015 compared to 2014.
EU imports of plywood in the first 11 months of 2015 were down from both Malaysia and Indonesia, the two largest suppliers. Imports from Malaysia were 7% less at 101,200m3 during the period. EU imports from Malaysia were nearly matched by those from Indonesia which, at 98,900 m3, were only 2% less than the previous year. China supplied 85,000 m3 of plywood with a tropical wood face to the EU in the first 11 months of 2015, 3% more than the same period the previous year. There was also a 16% rise in imports from Brazil but, at only 16,100m3, the volume remains low.
Contrasting plywood market trends within the EU
EU markets for tropical hardwood plywood showed contrasting trends in 2015. The relatively large UK market was flat and the Netherlands was buoyant, but most other markets were declining.
The UK imported 142,600 m3 of tropical plywood in the first eleven months of last year, 1% more than the previous year. The latest data suggests a small surge in UK imports in the last quarter of 2015. After the first three quarters, UK imports of tropical plywood were 4% lower than the year before.
Overall market conditions in the UK were not as buoyant in 2015 as they were in 2014. The UK Timber Trade Federation reports an overall reduction in wood product imports by 3.1% for the period from January to November 2015, blaming a slow-down in UK construction as a main factor behind this trend. In relation to hardwood plywood, including both temperate and tropical, the TTF records a 10.8% increase in imports during the period. This is mainly due to a rise in imports from China. UK imports from Indonesia also increased slightly, from a small base, but Malaysia suffered a significant loss of share in the UK plywood market last year.
The frequently mentioned recovery in the Dutch economy and building sector is reflected in a 23% jump in imports of tropical plywood to 59,548 m3 in the first 11 months of 2016. As in the UK, there was an uptick in plywood imports into the Netherlands in the last quarter of 2015. Last year, the Netherlands overtook Belgium to become the second largest EU importer of tropical plywood.
Other EU markets for tropical plywood were declining last year. Imports fell into Belgium (-11% to 59,466 m3), France (-1% to 42,034 m3), Germany (-17% to 21,859 m3) and Italy (-7% to 20,396 m3).
German importers interviewed at the timber trade federation GD Holz’s Branchentag trade show in November reported weakness in tropical plywood sales last year. Raw plywood from Indonesia and Malaysia, in particular, was replaced with more competitively priced hardwood plywood from Russia and Eastern Europe. The only grade from South-East Asia mentioned as selling well in Germany was film-faced 4 mm panels from Indonesia.
France fuels rise in EU tropical wood flooring imports
There was significant growth in EU import value of tropical wood flooring (+18.7% to €89.7 million) in the first eleven months of 2015. However, at 3.94 million m2, EU imports of tropical flooring were only 2% more than the year before. Imports of wood flooring from tropical countries are also small in relation to both domestic production (around 63 million m2 in 2014) and imports from China (18.7 million m2 in 2014).
There was a rise in imports from both Indonesia and Malaysia, the two largest tropical suppliers of wood flooring to the EU. Imports increased from Indonesia by 3% to 1.35 million m2 and by 2% from Malaysia to 1.22 million m2 in the first 11 months of 2015. In the October-November period, EU imports were slowing from Indonesia but picking up pace from Malaysia.
EU imports of flooring from Viet Nam also gained ground in the first eleven months of last year, rising 23% to 329,800 m2. Imports from Brazil also increased by 5% to 588,200m2. These gains offset a fall in imports from several smaller tropical suppliers of flooring to the EU including Thailand (-9%), Peru (-31%) and Hong Kong (-32%) (Chart 3).
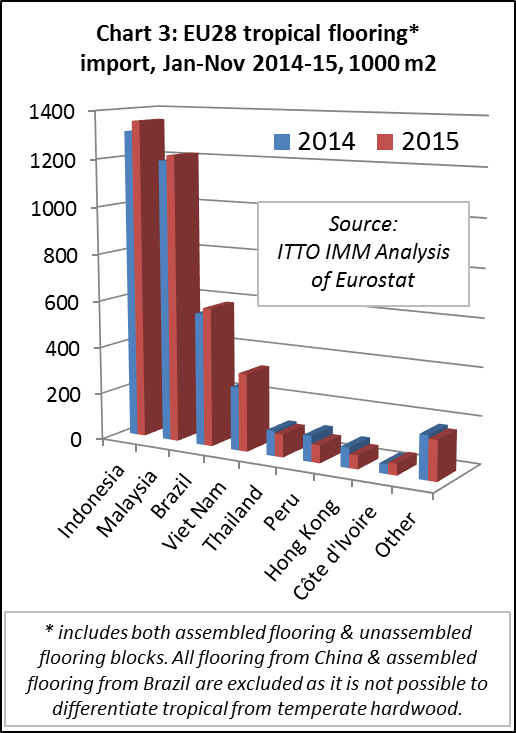
The rise in EU tropical wood flooring imports in 2015 is primarily due to France, by far the largest market for this commodity accounting for around one quarter of all EU imports. Imports into France increased 28% to 850,200m2 in the first 11 months of 2015.
During the same period, there was a rise in tropical wood flooring imports by the UK (+1% to 498,098 m2), Italy (+6% to 408,855 m2) and the Netherlands (+39% to 330,440 m2). However imports declined sharply into Belgium (-30% to 540,169 m2) and Germany (-13% to 381,565 m2).
Imports of flooring from China are excluded from Chart 2 only because it is not possible to differentiate tropical from temperate wood in the flooring statistics. However China is by far the largest external supplier of flooring products to the EU, much consisting of assembled multi-layers panels, and volumes over-shadow imports from tropical countries. An unknown proportion will contain tropical wood.
EU imports of wood flooring from China (including all products faced with real wood but excluding laminated flooring) were 16.0 million m2 from January to November 2015, down 8% from 17.4 million m2 in the same period of 2014. This follows a 5% gain in EU imports of Chinese flooring to 18.7 million m2 for the whole of 2014.
In the first 11 months of 2015, EU imports of Chinese flooring were stable into the UK at 4.8 million m2 and increased 10% to 1.2 million m2 into Sweden. However Chinese wood flooring imports were down 4% into Belgium at 2.7 million m2, down 21% into Italy at 1.9 million m2, down 6% into Netherlands at 1.8 million m2, and down 12% into Germany at 1.6 million m2 (Chart 4).
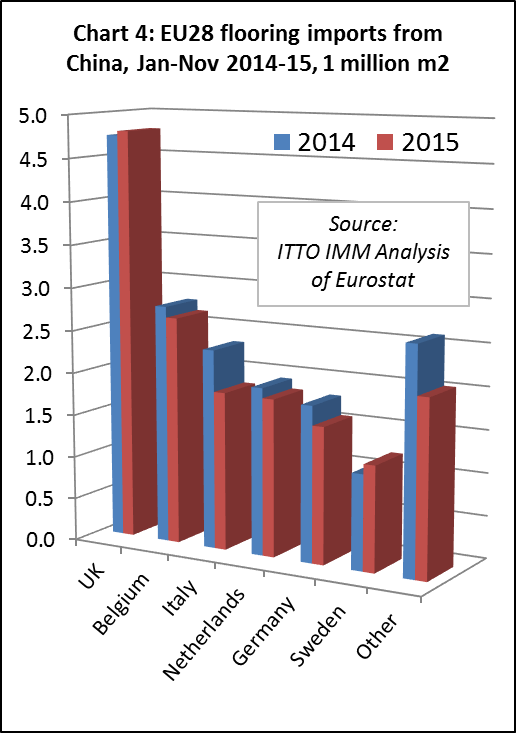
The decline in EU imports of Chinese flooring in 2015 was therefore concentrated in euro-zone countries and is most likely due to the weakness of the euro which boosted the competitiveness of domestic producers.
PDF of this article:
Copyright ITTO 2020 – All rights reserved