

Europe’s economy has regained a certain level of stability since the height of the financial crisis, but growth remains slow and there is no sign of acceleration. The EU28 group of nations recorded only 0.4% GDP growth in the second quarter of 2015, down from 0.5% in the first quarter and falling short of most forecasts.
The pace of growth is particularly slow in the euro-zone currency area which has yet to recoup output lost in the aftermath of the financial crisis. A particular concern is that growth remains stagnant at a time when the region is benefiting from massive stimulus on three fronts: a weaker euro exchange rate that typically boosts exports, lower oil prices that raise disposable incomes, and a bond-buying program of more than €1 trillion ($1.12 trillion) launched by the European Central Bank in March this year.
The second quarter slowdown in EU growth is largely due to France which recorded zero growth during the three month period after 0.7% growth in the first quarter. Although French exports are rising these have been insufficient to offset a continuing fall in domestic household consumption. The French government is stepping up efforts to boost private sector demand, having just announced an additional €11bn in tax cuts for companies and households over the next three years on top of €30bn in tax breaks already promised through the government’s so-called responsibility pact with business. However the government will have to cut public spending by €50 billion between 2015 and 2017 to fund the tax breaks.
Germany’s quarterly growth rate quickened to 0.4% in the second quarter from 0.3% in the first quarter of 2015. The main driver of growth in Germany this year has been a rise in exports as foreign trade received a boost from the weaker euro. Elsewhere in the euro-zone, the Italian, Dutch and Austrian economies all grew in the second quarter of 2015, but just barely. Once again there was better news from Spain where the recovery has continued to gather pace with 1% growth in GDP in the second quarter of 2015 following 0.9% in the first.
Outside the euro-zone, the UK economy continues to perform relatively well with GDP growth of 0.7% in the second quarter of 2015, up from 0.4% in the first quarter of the year.
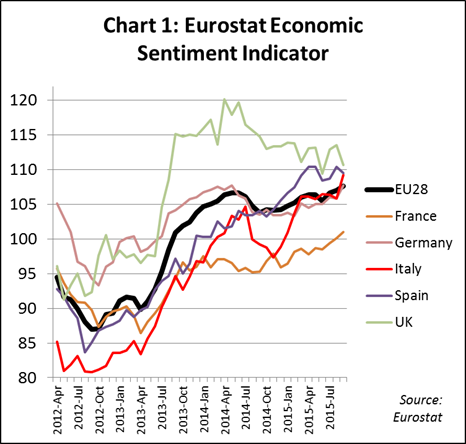
Trends in GDP growth are mirrored in Eurostat’s Economic Confidence Indicator (ECI), a forward-looking index that measures perceptions and expectations in five surveyed sectors (industry, services, retail trade, construction and consumers) in all EU Member States (Chart 1).
After a period of strong recovery in economic sentiment in 2013 and the first half of 2014, the ECI for the EU as a whole dipped during winter 2014/2015 and has recovered only slowly since then. The dip was mainly due to a sharp fall in sentiment in Italy at a time when the UK and Germany were also sliding from the heights achieved in mid-2014. Sentiment has been recovering slowly in France and rapidly in Spain over the same period.
The good news is that overall EU-wide sentiment has remained above 100 throughout this period – indicating above average economic sentiment. This is despite widely publicised financial problems in Greece leading to some renewed concern about the long-term stability of the euro.
European construction static at a low level
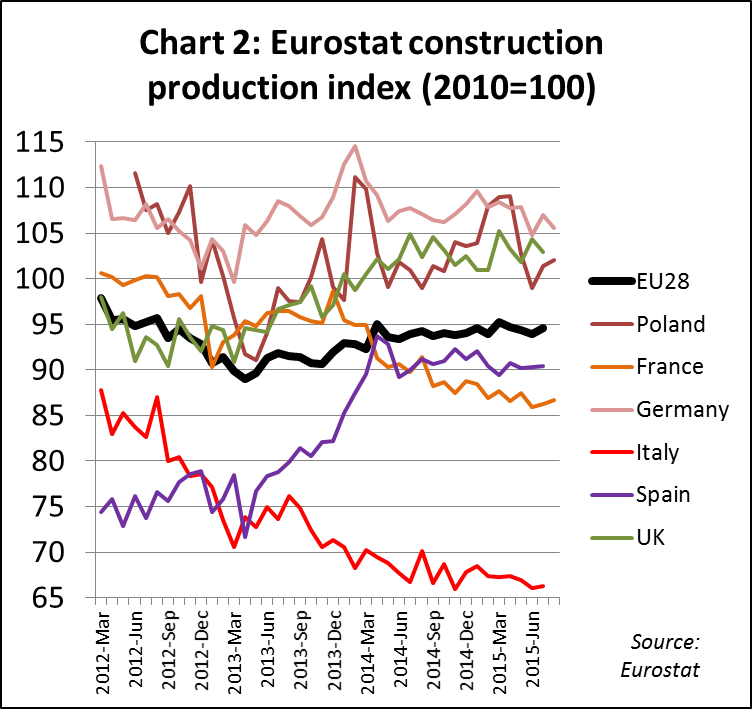
Europe-wide, the construction industry continues to disappoint. Although overall European construction activity hit bottom in March 2013, it increased only slowly until April 2014 and has been static at 5% below the 2010 level since then. Construction activity in France has been sliding in recent months, while Italy still remains extremely depressed. More positively, the gains made in UK and Spanish construction activity in 2014 have been maintained in 2015 while activity in Germany remains stable at a high level (Chart 2).
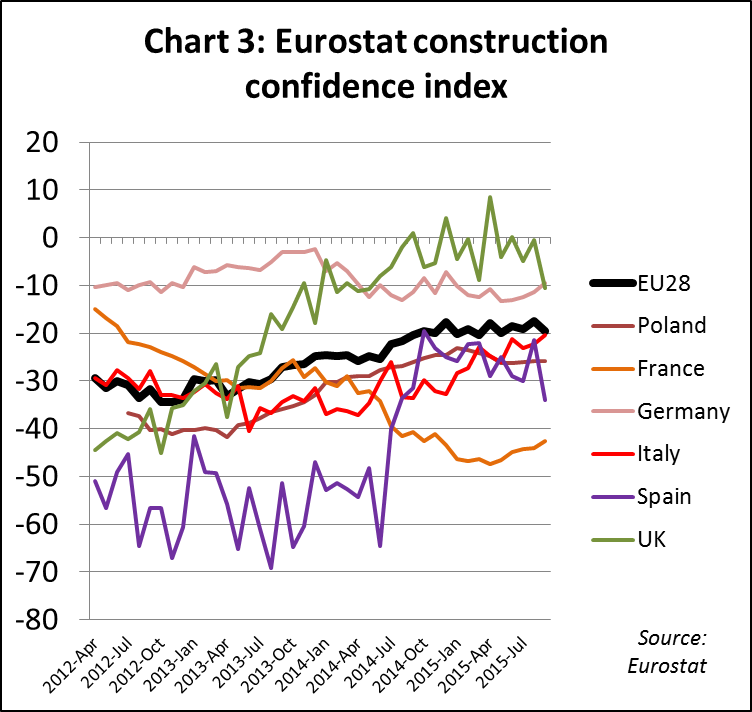
The Eurostat Construction Confidence Index in the EU remains stagnant and deep in negative territory, indicating that many in the industry still expect market conditions to deteriorate rather than to improve in the next three months. Confidence in France dipped sharply during the summer this year. However confidence is higher in the UK and Germany than elsewhere in Europe. Confidence in Italy, while still low, has been improving this year (Chart 3).
More positively, the latest EU-wide data for building permits shows that across Europe these recorded two consecutive quarters of growth in the first half of 2015, the first time this has occurred for at least 5 years. Building permits have increased this year in most main EU markets, growing particularly rapidly in Spain and the Netherlands (Chart 4).
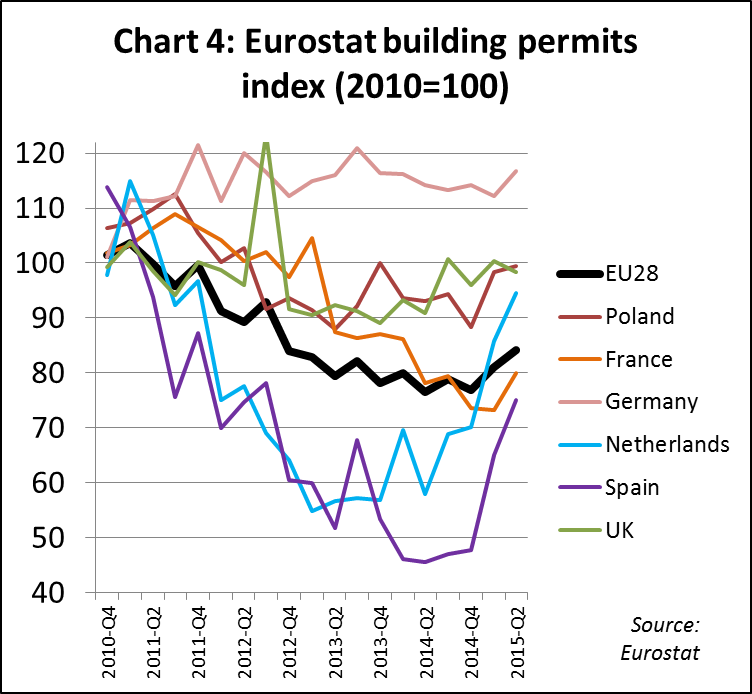
The growth in building permits, a forward looking indicator, is reflected in forecasts which generally remain optimistic about the prospects for sustained recovery in European construction over the medium to long term.
A report by Building Radar, an independent research agency, forecasts that EU-wide construction activity will increase by 2% per annum between 2015 and 2017, and then by around 3% per annum between 2018 and 2020. New build growth is expected to rise to around 7.6% in 2020 while growth in renovation and maintenance will rise more slowly to around 4.5% by 2020. At these growth rates, the total value of EU construction would increase from €1305 billion in 2014 to €1502 billion in 2020. Although the value of EU construction in 2020 would still be below the peak level just prior to the financial crises (in excess €1600 billion in 2007 at constant prices), the sector remains vast and generates a huge level of activity.
European wood joinery production stabilises in 2014
According to newly-published Eurostat data, the total value of EU production of wooden doors and windows increased slightly in 2014 after a period of decline. EU imports of both commodities also rebounded from the low levels recorded the previous year. However domestic producers maintained their hugely dominant position in these market segments.
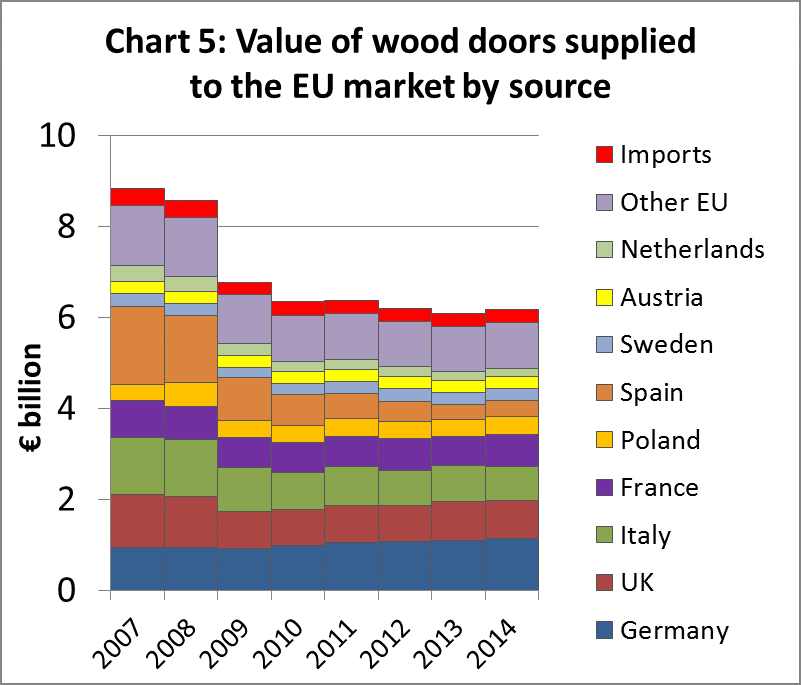
EU wooden door production was €6.18 billion in 2014, up 1.6% compared to the previous year (Chart 5). Wooden door production increased in Germany (+2.6% to €1370 m), France (+9.2% to €698m), Poland (+5.4% to €398m) and Spain (+6.7% to €349m). However this was offset by a fall in production in Italy (-4.3% to €750m) and Sweden (-2.8% to €267m). Production in the UK remained stable at €844m.
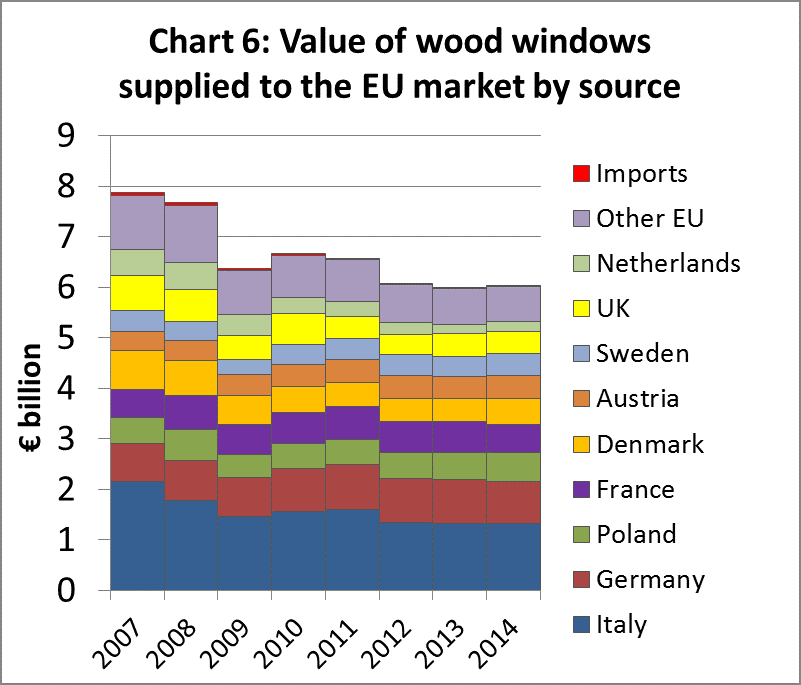
EU wood window production increased 0.5% from €6.00 billion in 2013 to €6.03 billion in 2014 (Chart 6). During 2014 production remained stable at €1.32 billion in Italy, the largest wood window manufacturing country. Production fell during 2014 in Germany (-3.1% to €840m), France (-10.7% to €546m), and the UK (-6.1% to €425m). However these losses were offset by rising production in Poland (+4.9% to €574m), Denmark (+14.1% to €505m), Austria (+4.2% to €469m), Sweden (+13.1 to €437m) and the Netherlands (+10.7% to €206m).
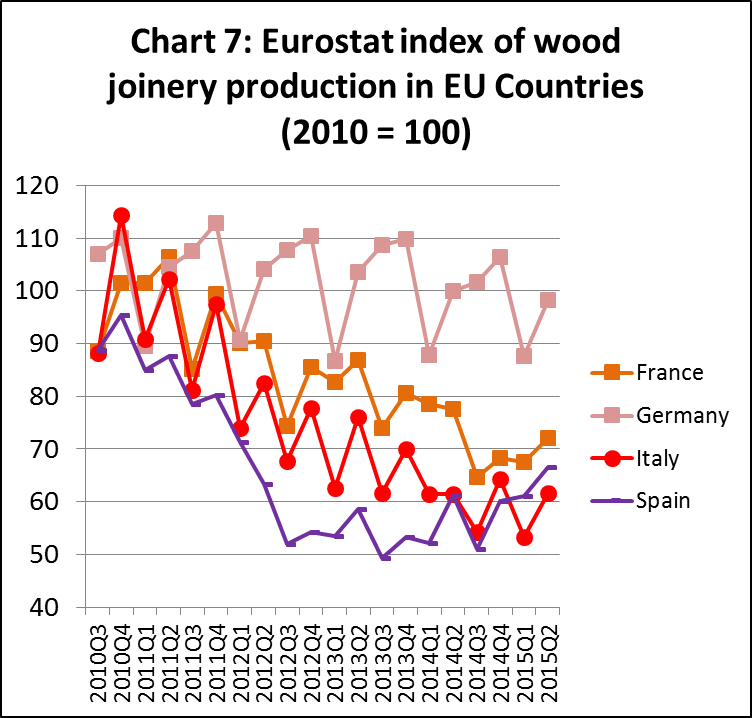
The Eurostat index of joinery production in EU countries (which excludes flooring but includes doors, windows and glulam and covers only a few countries) shows that production stabilised at a low level in Italy and France in the first half of 2015 after 5 years of continuous decline. Production in Spain has recovered slightly this year but is still 30% down on the 2010 level. Production in Germany, while varying on a seasonal basis, has been relatively stable overall during the last 5 years (Chart 7).
EU wood door imports rise 20% in 2015
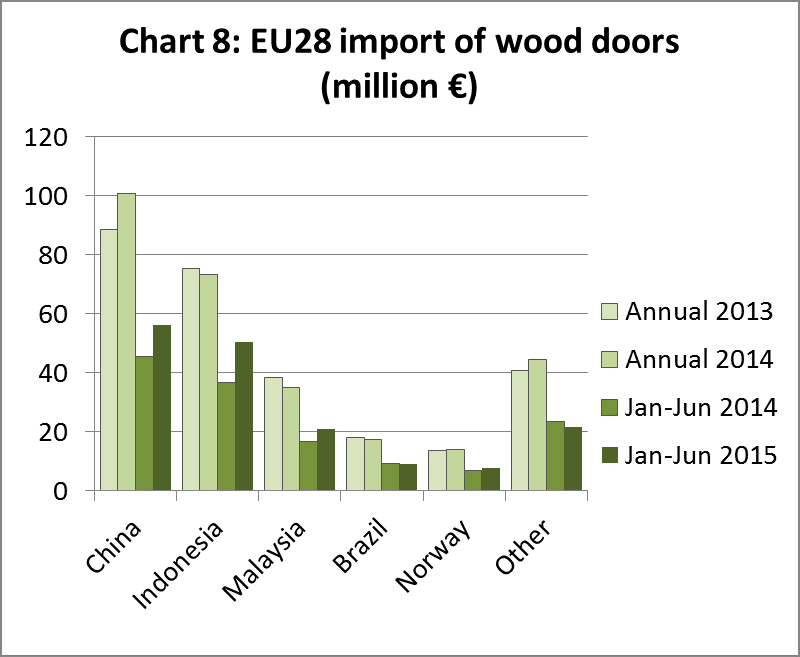
Imports of wood doors into the EU were valued at €168m in the first 6 months of 2015, 20% more than the same period last year (Chart 8). Imports from China increased 24% to €56.4m, while imports from Indonesia increased 37% to €50.5m and imports from Malaysia were up 26% at €21.1m. Imports of wood doors from Brazil remained stable at €9.3m during the period. Imports accounted for around 4.6% of the total supply of EU wooden door consumption in 2015, up slightly from 4.5% in 2013 but down from 5% in 2010.
Negligible EU imports of wood windows
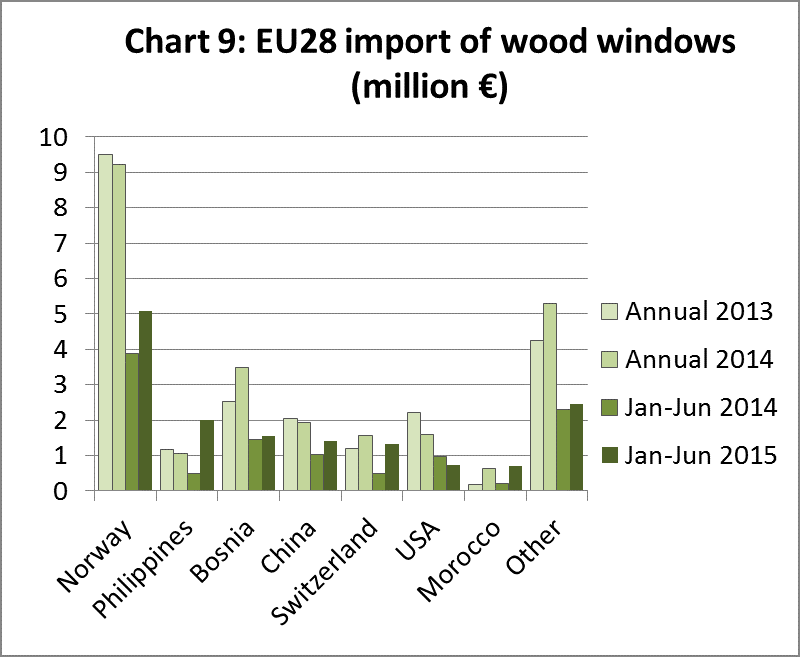
The EU market for wood windows is very heavily dominated by domestic producers. In 2014, imports accounted for only 0.4% of the total value of EU wooden window consumption, the same as the previous year but down from 0.8% in 2007. EU imports of wood windows in the first six months of 2015 were valued at €15.3m, 42% more than the same period in 2014. Most wood windows imported into the EU derive from other European countries, including Norway, Bosnia and Switzerland. Imports from all these countries increased in the first half of 2015. However the largest increase in imports was from the Philippines which surged to €2m in the first half of 2015, more than three times the value of the same period in 2014 (Chart 9).
EU glulam imports continue to rise in 2015
The EU imported 65,300m3 of glulam products in the first half of 2015, 6% more than the same period in 2014. Imports from Russia increased 10% to 14,600 m3 during the period (Chart 10). There was also a 20% increase in imports from Indonesia to 12,900 m3. Imports from Malaysia and China were stable in the first six months of 2015, at 11,000 m3 and 7000 m3 respectively.
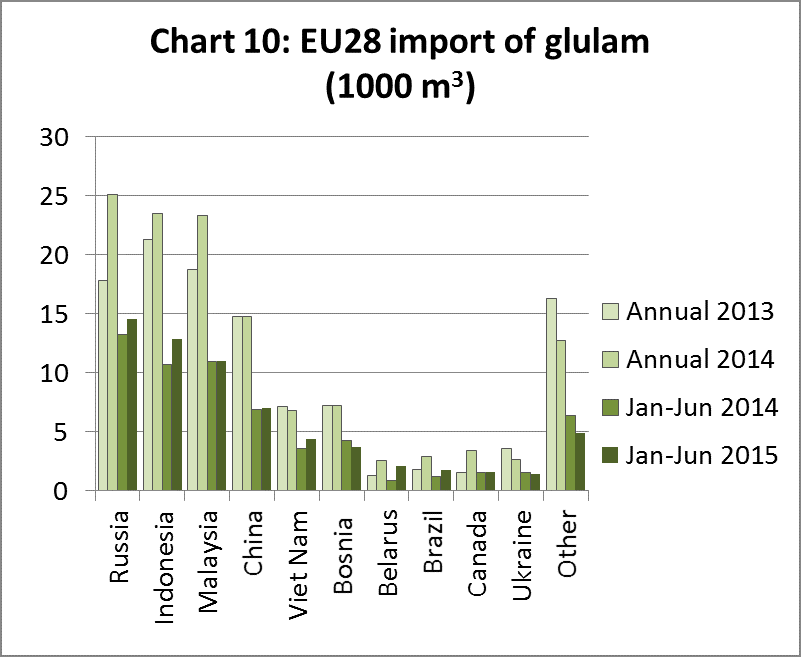
Imports of glulam account for around 5% of total EU consumption of this commodity. Much of the imported glulam consists of laminated veneer lumber for window manufacturing. Glulam imports from Russia and China are primarily pine and larch. Imports from Malaysia and Indonesia consist of meranti.
EU imports of joinery products from China rise 26%
EU28 imports of joinery products (excluding flooring) from China had a value of €68.5 million in the first 6 months of 2015, 26% more than the same period the previous year. Chart 14 summarises EU imports of joinery products from China by product group and EU Member State. Doors make up the bulk of EU joinery trade with China, with total value of €100.7 million in 2014. The UK and Romania are the main European markets for China’s wooden doors and imports by both countries have been rising in the last three years. Imports of wood doors from China are also rising in Ireland and Belgium this year. However imports by France have declined this year after rising in 2014.
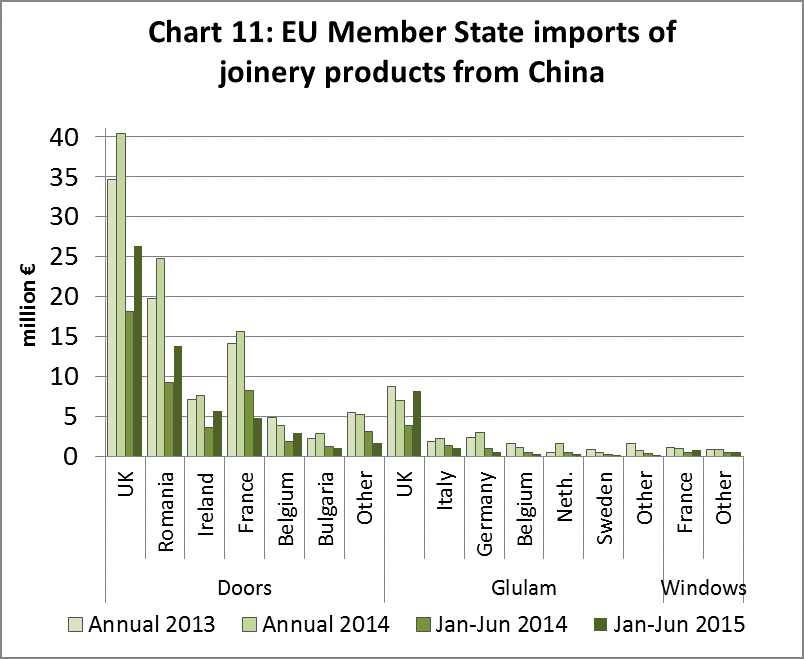
EU imports of glulam products from China were €10.7m in the first 6 months of 2015, 36% more than the same period in 2015. The UK is the only EU country importing significant quantities of glulam products from China. UK imports of Chinese glulam fell 18% last year but have rebounded strongly in 2015, reaching €8.2 million in the first 6 months, more than during the whole of 2014.
EU imports of finished wood windows from China increased 35% in the first 6 months of 2015, but were still negligible with a value of only €1.4m, mainly destined for France.
CLT development creates new opportunities for hardwood
The latest UNECE Forest Products Annual Market Review highlights the rapid growth in the market for cross-laminated lumber (CLT) and the new opportunities the product creates for wood, including hardwood, to compete in high-end structural applications. Although the first CLT production facilities were constructed in the DACH countries (Germany, Austria and Switzerland) in 1994, the full potential is only now being realised following a long period of technical and market development. CLT first entered the building market during the 2005 to 2010 period, transforming from a small-scale niche product into large-scale industrial production.
CLT panels consist of several layers of structural lumber boards stacked crosswise (typically at 90 degrees) and glued together on their wide faces and, sometimes, on the narrow faces as well. In special configurations, consecutive layers may be placed in the same direction to obtain specific structural characteristics. CLT products are usually fabricated with three to seven layers, but with additional layers in some cases. Thickness of individual lumber pieces typically varies from 16 mm to 51 mm and width varies from 60 mm to 240 mm. Boards are finger-jointed using structural adhesive. Lumber is visually-graded or machine stress-rated and is kiln dried. Panel sizes vary by manufacturer; typical widths are 0.6m, 1.2m, and3 m, while length can be up to 18m and thickness up to 508 mm.
The dimensions and lay-up of CLT production are now internationally standardized and recognised, and production techniques are optimized in modern manufacturing facilities. CLT is designed to maximise yield, utilise lower grades of lumber, and it can be made in a high volume of very large sections. The result is a light but very strong panel product that can be made off-site and erected quickly to form structural walls, floors and ceilings. CLT is used in a wide range of applications in single-family houses, multi-storey towers, public buildings and specialty construction.
CLT offers new opportunities for wood to compete in large-scale structural applications dominated for many years by concrete and steel. In addition to delivering comparable technical performance, CLT panels can readily out-perform these alternatives on environmental issues. Wood’s renewability, low embodied energy, and potential as a carbon store during use are all considerable benefits.
Global production of CLT was about 625000 m3 in 2014, and this figure is forecast to increase to about 700000 m3 in 2015. About 90% (560 thousand m3) of global cross-laminated timber (CLT) was produced in Europe in 2014, and this is forecast to increase to 630 thousand m³ in 2015. The DACH countries have continued to be the driving force in CLT development, not only as the originators of CLT products but also as the leading CLT producers. Austria has seven CLT production facilities, Germany three and Switzerland two. Minor production sites exist in Finland, Italy, Norway, Spain and Sweden, and more CLT factories are under construction in Finland, France, Sweden and the UK. The central European CLT industry is strongly export oriented, supplying other parts of Europe as well as overseas markets.
The use of CLT is making possible the construction of tall wooden buildings. The current record-holder is a 14-storey residential high-rise in Bergen, Norway, and an 18-storey wooden building is planned in Vancouver, Canada. Earthquake-prone countries such as Japan have shown keen interest in increasing the use of CLT, and Japan has published a roadmap to pave the way for CLT in the Japanese building market.
To date commercial production of CLT has been dominated by softwood, notably Norway spruce and Sitka spruce, for reasons of price and wood consistency. However the American Hardwood Export Council (AHEC) is also now promoting development of hardwood CLT, noting that some hardwood species are under-utilised and readily available at competitive prices while also offering up to twice the inherent strength of softwoods. This last factor presents an opportunity to significantly reduce the amount of fibre, or mass, required to achieve the same strength performance. Hardwood species also provide opportunities to improve the appearance of CLT panels.
AHEC is particularly promoting the potential for CLT in tulipwood (Liriodendron tulipifera), an abundant U.S. hardwood species. Other temperate hardwood species with potential include poplar and birch. The potential for tropical hardwood CLT has yet to be seriously explored, but there may be specific opportunities for some faster growing plantation species or the pioneer species found in large quantities in secondary tropical forests. Eucalyptus is generally considered too difficult to machine to be a viable option for CLT, but recently progress is being made in Australia to develop a related product under the brand name “Cross Laminated Strand Timber” by Melbourne-based Lignor.
The international CLT product and design standards, and open-source software packages such as the CLTdesigner have supported the international trade of CLT. Standardization in Europe comprises product standard EN 16351 (currently a draft version, with legal validity envisaged by the end of 2015) and design standard EN 1995-1-1 (currently in revision).
For a review of the CLT market see UNECE Forest Products Annual Market Review 2014-15: http://www.unece.org/fileadmin/DAM/timber/publications/2015-FPAMR.pdf
For more technical details see paper by Mohammad et al: http://www.forestprod.org/buy_publications/resources/untitled/summer2012/Volume%2022,%20Issue%202%20Mohammad.pdf.
PDF of this article:
Copyright ITTO 2020 – All rights reserved