

Previous ITTO reports have highlighted how European furniture manufacturers have been taking larger share of the internal EU market in recent years, gradually squeezing out overseas competitors. This trend has been driven partly by increased price competitiveness at a time when the euro and other European currencies have been weak relative to the US dollar.
There are also more enduring factors, including the underlying strength of European furniture manufacturers and their brands in terms of innovation and design; the obstacles to overseas suppliers complying with complex EU technical and environmental standards; and the expansion of furniture manufacturing in Eastern Europe, a location which combines ready access to raw materials, relatively cheap labour, and the internal EU market.
The latest Eurostat data shows that European manufacturers share of the EU internal market increased even more sharply last year than indicated by preliminary estimates. However, there are also signs that suppliers in China and South-East Asia are clawing back some market share in 2017.
Analysis of official Eurostat manufacturing production data for 2016, just released in August, shows that wood furniture production value in the EU increased by 3.3% to €40.1 billion last year (Chart 1). That is the highest level of production since 2008. It is also greater than the preliminary estimate of 2016 production of €39.6 billion reported in the previous ITTO TTM report on the EU wood furniture market published in May 2017 (based on analysis of EU trade flow volumes and other indices of furniture business activity).
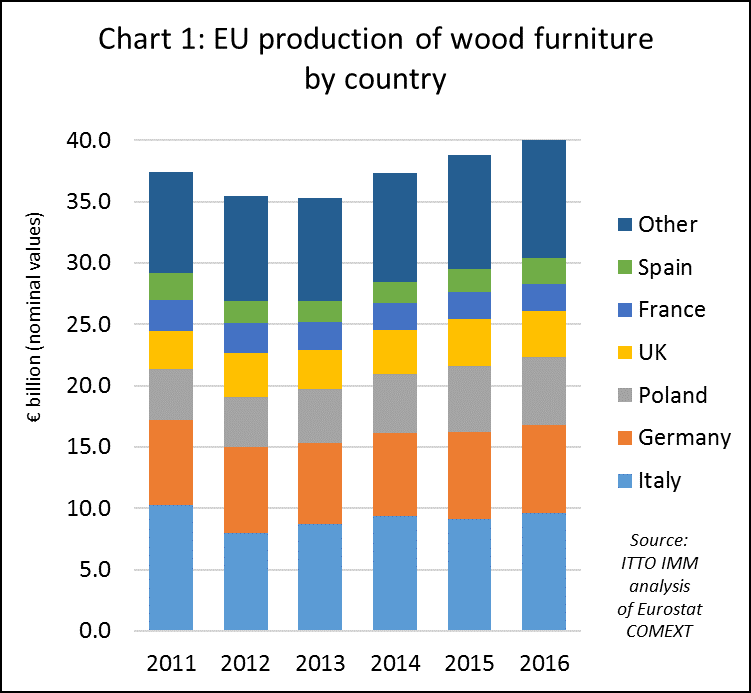
According to the latest Eurostat data, EU wood furniture consumption increased 3% to €36.7 billion in 2016. This compares to the preliminary estimate of €36.1 billion reported in the ITTO TTM report in May.
The latest Eurostat data reveals that wood furniture consumption in Italy increased by more than 10% in 2016, to €5.7 billion, recovering ground lost the previous year (Chart 2). This is a much larger increase than initially predicted given widespread reports of slow economic growth and weak consumer confidence in the country.
However, Italian furniture consumption last year was boosted by the Italian Stability law implemented in January 2016 to support the national economy. The law included tax credits for building renovation work, including a bonus for new furniture, and direct public support for the “Made in Italy” brand.
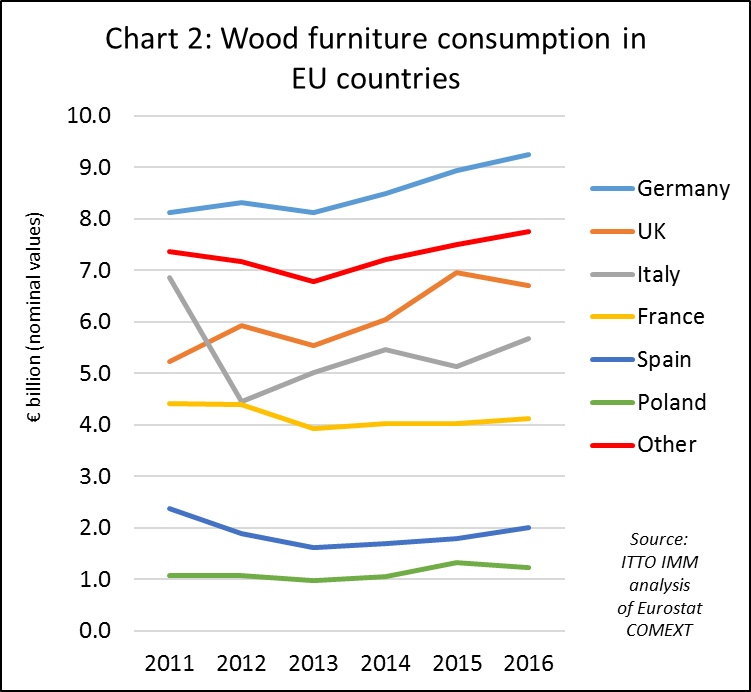
In addition to Italy, wood furniture consumption increased in several other key EU markets in 2016 including Germany (rising 4% to €9.2 billion), France (rising 2% to €4.1 billion) and Spain (rising 12% to €2 billion). These gains offset a 4% decline in consumption in the UK, a trend widely forecast owing to the economic uncertainty and weakness of the British pound following the Brexit vote.
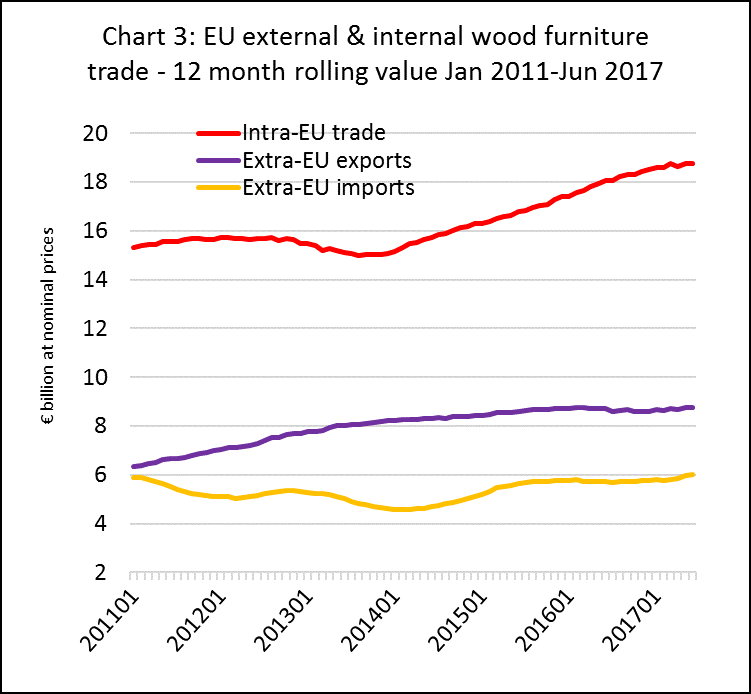
Analysis of Eurostat trade data reveals that internal EU trade in wood furniture, which increased 4% to €16.2 billion in 2016, continued to rise in 2017. This trend is driven both by the slow rise in EU consumption and by rising dependence of the internal EU market on manufacturers located in lower cost member states of Eastern Europe, particularly Poland, Romania, and Lithuania.
The EU has maintained a trade surplus in wood furniture since 2011 when exports to non-EU countries overtook imports from outside the EU. This surplus remained broadly flat between the start of 2015 and the first quarter of 2016 (averaging close to €3 billion per annum), as both imports and exports were stable. However, there were some early signs of a slight narrowing in the trade surplus in the second quarter of 2017 (to around €2.8 billion per annum) as imports began to pick up. (Chart 3).
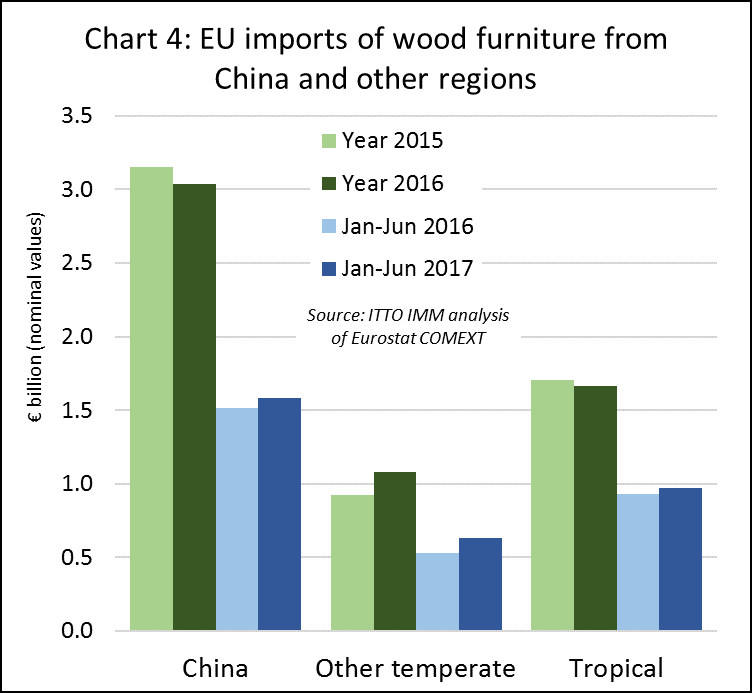
After slipping back last year, EU wood furniture imports from tropical countries and China recovered some lost ground in the first 6 months of 2017. EU imports from tropical countries increased 4.5% to €970 million, while imports from China increased nearly 5% to €1.58 billion.
However, the biggest gains in EU imports of wood furniture this year are from other temperate countries, mainly bordering the EU such as Bosnia, Turkey, Switzerland and Ukraine. EU imports from these countries increased 20% to €630 million in the first 6 months of 2017, building on a 14% gain recorded the previous year. (Chart 4).
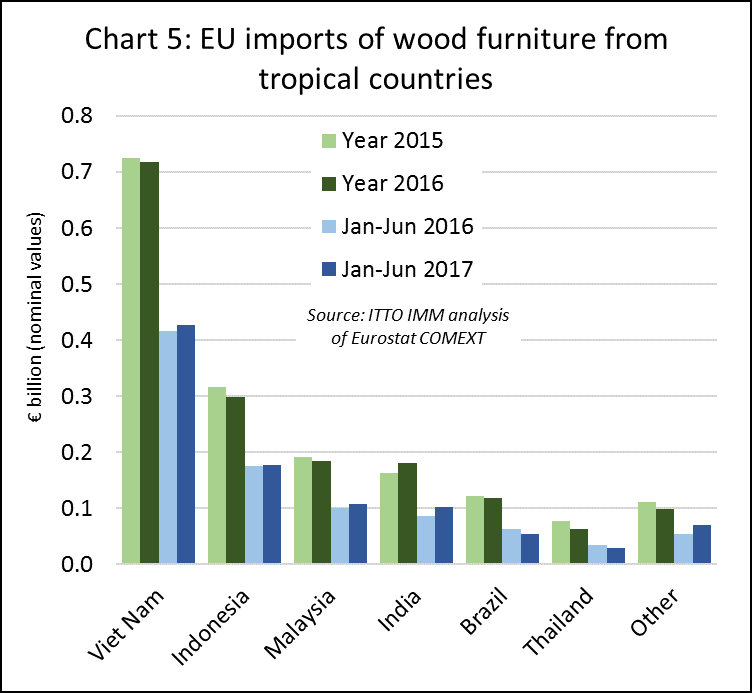
The share of the various tropical countries in supply of wood furniture to the EU has varied quite widely this year. After falling 2% to €716 million in 2016, EU imports from Viet Nam rebounded 3% to €427 million in the first six months of 2017. Imports from Indonesia also increased during the period, but by only 1% to €178 million, not sufficient to recover ground lost in 2016. Imports from Malaysia recovered more strongly in the first half of this year, rising nearly 8% to €108 million. Imports from India have also continued to rise, up 18% to €103 million during the six-month period. (Chart 5).
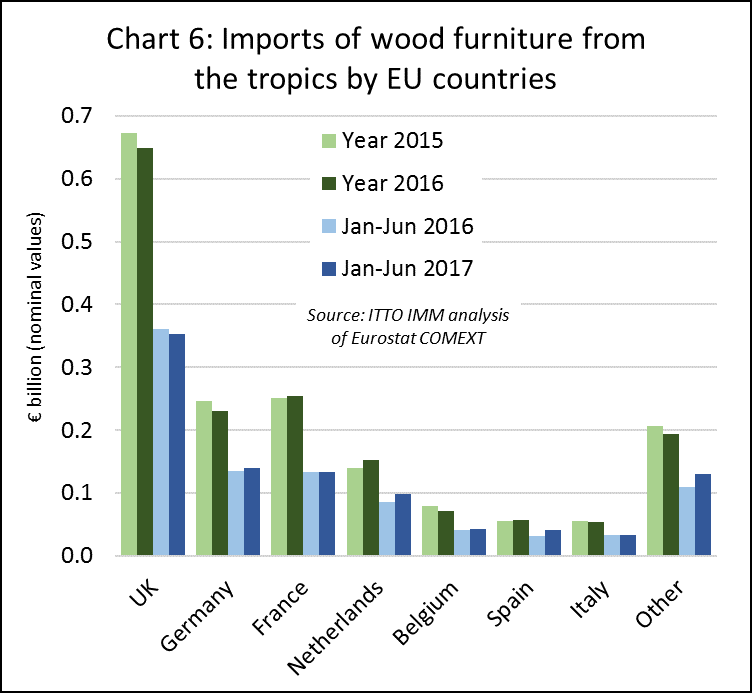
There were also significant shifts in the destinations for furniture exported into the EU from tropical countries in the first half of 2017. The UK imported €353 million of wood furniture from tropical countries between January and June 2017, 2% less than the same period in 2016. Imports of tropical wood furniture in Italy also declined, by 4% to just €33 million, a sign that the recent surge in Italian furniture consumption has not been to the benefit of tropical suppliers.
However, all other leading EU furniture markets imported more furniture from tropical countries in the first 6 months of 2017 compared to the same period the previous year. Imports increased 3% to €139 million in Germany, 1% to €134 million in France, 16% to €99 million in the Netherlands, 4% to €43 million in Belgium, and 30% to €42 million in Spain. (Chart 6).
European destinations for wood furniture imported from individual tropical countries have shifted this year. A significant decline in UK trade with Viet Nam in the first half of 2017 was offset by rising Viet Nam trade with a wide range of other EU markets including Sweden, Spain, France, Poland, Denmark, Ireland, Greece and Austria.
A decline in UK, French and Swedish imports from Indonesia, was compensated by a rise in Indonesian trade with Spain, Netherlands and Ireland during the six-month period. Malaysia exported less to Sweden and Germany, but increased sales to the UK, Poland and Ireland. The rise in EU imports from India this year is mainly concentrated in the UK, Netherlands and Germany.
‘Top 200’ account for nearly a quarter of world furniture production
Of the world’s 200 top furniture manufacturers, 40% are headquartered in the EU, 22% in North America, 31% in Asia Pacific, 2% in South America, and 2% in central Eastern Europe, Russia and Turkey. The “Top 200” account for around 23% of total world furniture production, indicating a relatively low degree of concentration in a sector which continues to be dominated by smaller enterprises.
These are key conclusions of a new report on the Top 200 published by CSIL, the Italian furniture industry research organisation.
The report also highlights that around 65% of the Top 200 are involved only in manufacturing and the remaining 35% operate both as manufacturers and retailers. The share of companies that directly manage retailing activities increases with the size of the company. The share is highest in the upholstered market segment and lowest in the office and kitchen segments which tend to be more dependent on other channels such as contract sales and direct sales to building companies.
The Top 200 have an average turnover per employee of USD178,000 per year, with the larger companies generally having higher levels of productivity. This is due partly to their greater investment in R&D and production machinery, and a greater propensity to operate via subcontracting and specialist production units.
The report notes that total world furniture production was worth about USD 400 billion in 2016, a slight gain on 2015, but marginally down on 2014. However, in recent years, world furniture trade has been growing faster than production with greater concentration in low-cost manufacturing hub locations. The Top 200 are gradually increasing their share of global production and sales. In 2016, the turnover of the Top 200 was 17% higher than in 2011, rising year-on-year more rapidly than the market as whole.
Details of the CSIL ‘Top 200 Furniture Manufacturers Worldwide” report are available at www.worldfurnitureonline.com
PDF of this article:
Copyright ITTO 2020 – All rights reserved