

The EU’s trade in tropical wood products was more buoyant in the first nine of months of 2019 than the same period in 2018. However, the rise in imports, which began in the second quarter of 2018, has levelled off since June this year.
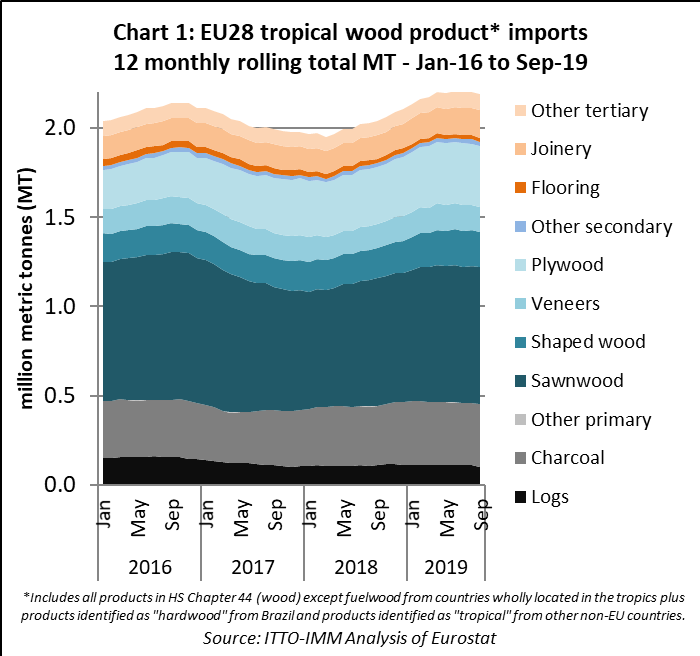
Chart 1 shows twelve monthly rolling total imports (to iron out seasonal fluctuations) into the EU of all tropical wood products listed in HS Chapter 44 (excluding fuelwood, wood waste and chips). It shows that the 12-month rolling total dipped to 1.95 million metric tonnes (MT) in March 2018, then increased to a peak of 2.21 million MT in June 2019 before slipping back slightly to 2.19 million MT in September 2019.
The slowing pace of growth in European tropical wood imports coincides with mounting signs of weakness in the wider economy. In its new Regional Economic Outlook for Europe, issued on 6th November, the IMF points out that growth has slowed this year. Although that’s mainly due to weaker global trade (thanks to the US-China tariffs), and a slowdown in manufacturing this year, there are signs that the weakness is spreading.
According to the IMF, “for most of the region, the slowdown remains externally driven. However, some signs of softer domestic demand have started to appear, especially in investment. Services and domestic consumption have been buoyant so far, but their resilience is tightly linked to labor market conditions, which, despite some easing, remain robust. Expansionary fiscal policy in many countries and looser financial conditions have also supported domestic demand”.
IMF forecasts that Europe’s growth will decline from 2.3% in 2018 to 1.4% in 2019. A modest and precarious recovery is forecast for 2020, with growth reaching 1.8%, as global trade is expected to pick up and some economies recover from past stresses.
IMF notes that this projection masks significant differences between “advanced” (i.e. mainly Western) and “emerging” (mainly Eastern) Europe and that “growth in advanced Europe has been revised down by 0.1 percentage point to 1.3 percent in 2019, while growth in emerging Europe has been revised up by 0.5 percentage point to 1.8 percent”.
IMF also emphasises downside risks that could lead to weaker growth in 2020: “amid high uncertainty, there are several risks to the outlook, including Brexit-related disruptions, intensifications of protectionism and related uncertainty, abrupt declines in risk appetite, and rising geopolitical tensions”.
In total, the EU imported 1.66 million MT of tropical wood products in the first nine months of 2019, 5.3% more than the same period in 2018. The total value of EU imports of tropical wood products in the January to September 2019 period was €1.80 billion, 9% more than the same period in 2018.
So far this year, there have been gains in EU imports of tropical sawnwood, charcoal, plywood, mouldings, and joinery products. These have been only partly offset by a decline in imports of tropical logs, veneers, and flooring.
7% rise in EU imports of tropical sawnwood
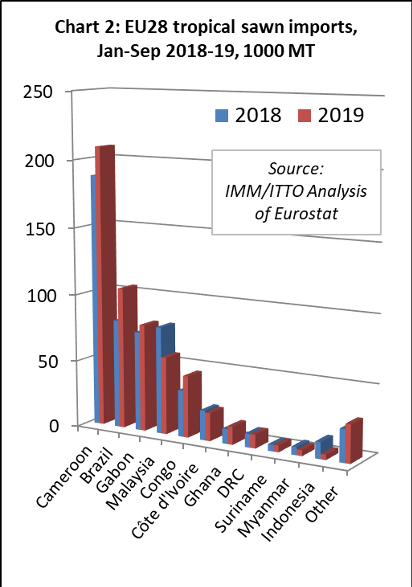
EU imports of tropical sawn wood increased 7% to 582,500 MT in the first nine months of 2019 compared to the same period in 2018. Import value increased 3% to €557.9 million. This aligns with market commentary earlier in the year, with sawn hardwood importers reporting generally steady, in some cases strong trading in 2019 including in tropical timber, despite some slowdown in economic activity and increased downside concerns about the medium-term outlook.
Imports from Cameroon, particularly slow in 2018, increased 11% to 209,000 MT during the first nine months of 2019. Imports also increased sharply from several other countries including Brazil (up 30% to 105,100 MT), Gabon (up 8% to 79,600 MT), Congo (up 32% to 45,800 MT), and Ghana (up 20% to 13,300 MT). After a strong start to the year, imports from DRC were 10,100 MT in the first nine months of 2019, only 1% more than the same period in 2018. These gains offset a 28% decline in imports from Malaysia, to 57,500 MT, and a 6% decline from Côte d’Ivoire to 20,900 MT (Chart 2).
The decline in EU imports from Malaysia this year was attributed by some importers to a decline in the availability of PEFC certified product following the suspension of MTCS certification in Johor and Kedar states in May this year which led to the total certified area in Malaysia to fall by around 25%. According to MTCS, both states are now working to regain their MTCS certificates. At present, MTCS-certified forest areas consist of 4.2 million hectares of natural forests and 109,025 hectares of forest plantation.
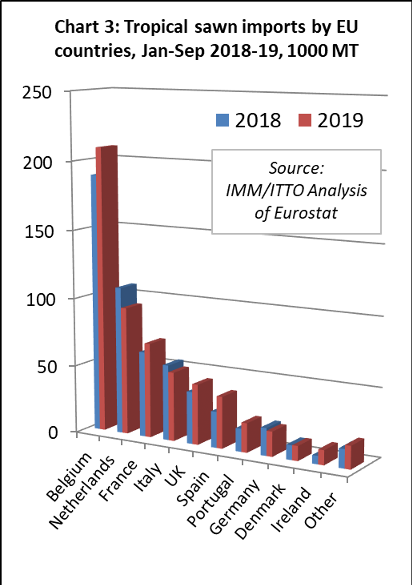
The trend towards increased concentration of tropical sawn wood imports into the EU by way of Belgium has continued this year. In the first half of 2019 compared to the same period in 2018, imports into Belgium increased 11% to 209,200 MT.
However, direct imports of sawnwood from tropical countries also increased in some EU countries in the first nine months of 2019. Imports increased in France (up 11% to 69,400 MT), the UK (up 16% to 44,200 MT), Spain (up 38% to 43,700 MT), Portugal (up 28% to 21,400 MT), and Ireland (up 78% to 10,800 MT). These gains offset declining imports in the Netherlands (-13% to 93,600 MT), Italy (-9% to 50,500 MT) and Germany (-9% to 18,200 MT) (Chart 3).
EU imports of tropical logs slow in third quarter
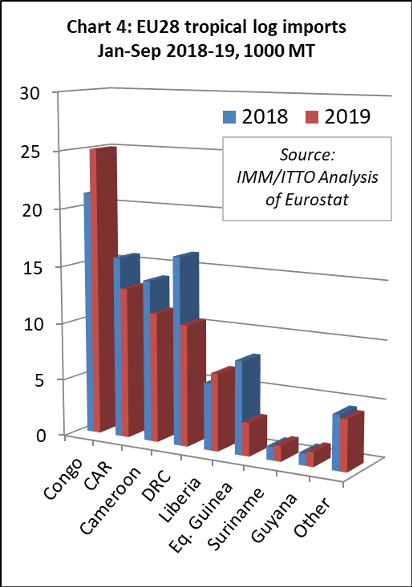
After recovering ground in 2018 and stabilising in the first half of 2019, EU imports of tropical logs slowed in the third quarter of 2019. Imports of 76,700 MT during the first nine of the year were 13% less than the same period in 2018. Import value fell 14% to €37.3 million during the period.
In the first nine months of 2019, EU imports of tropical logs increased by 18% to 25,100 MT from Congo, the leading supplier, by 16% from Liberia to 6,700 MT, by 17% from Suriname to 1300 MT, and by 20% from Guyana to 1,200 MT. However, these gains were offset by falling imports from the Central African Republic (-17% to 13,200 MT), DRC (-35% to 10,600 MT), Cameroon (-20% to 11,300 MT), and Equatorial Guinea (-64% to 2,900 MT) (Chart 4).
After a more buoyant second quarter, imports of tropical logs slowed into France and Belgium in the third quarter of 2019. By the end of the first nine months, France had imported 28,900 MT of tropical logs, 13% less than the same period in 2018, while imports into Belgium were down 23%, at 18,300 MT. Imports were also down 21% to 11,700 MT in Portugal during this period.
Rising log imports in some smaller markets, including Italy (+3% to 7,900 MT), the Netherlands (+18% to 2,100 MT) and Spain (+11% to 2,100 MT) were insufficient to offset falling imports in France, Belgium and Portugal.
EU imports of tropical decking buoyant this year
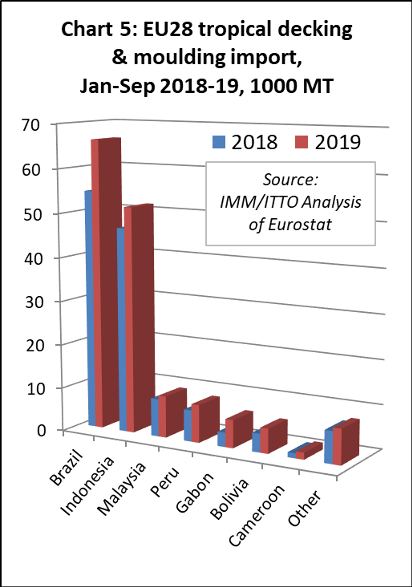
EU imports of tropical mouldings (which includes both interior mouldings and exterior decking products) increased sharply, by 19%, to 157,600 MT in the first nine months of 2019. Import value increased 26% to €239 million.
EU imports of tropical mouldings increased from all the leading suppliers of this commodity in the first nine months of 2019 including Brazil (+21% to 66,300 MT), Indonesia (+10% to 51,600 MT), Peru (+20% to 8,600 MT), Malaysia (+11% to 9,500 MT), Gabon (+95% to 6,400 MT) and Bolivia (+33% to 5,600 MT) (Chart 5).
In the first nine months of 2019, imports of tropical mouldings increased in France (+36% to 49,500 MT), Netherlands (+39% to 26,600 MT), the UK (+26% to 9,400 MT), Italy (+18% to 6,800 MT) and Denmark (+18% to 3,800 MT). However, imports weakened in Germany, down 6% to 28,300 MT, and Belgium, down 3% to 22,400 MT.
EU imports of tropical veneer down 6%
Following a similar trajectory to sawn hardwood imports, EU imports of tropical veneer slowed in the third quarter of 2019 after a strong performance in the first six months of the year. Imports, which were up 10% on the previous year in the first half of 2019, declined 2% to 102,000 MT in the nine months to September. Import value decreased 1% to €131.7 million during this period.
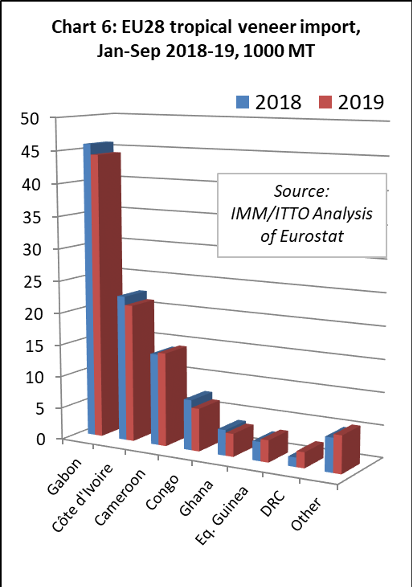
The EU imported 44,200 MT of veneer from Gabon in the first nine months of 2019, 4% less than in the same period in 2018. Imports also declined from Cote d’Ivoire (-6% to 21,400 MT), Republic of Congo (-15% to 6,600 MT), and Ghana (-10% to 3,600 MT). However, imports from Cameroon stayed just ahead of last year’s level, at 14,500 MT two percent more than the same period in 2018. There was also a significant increase in imports from DRC, by 69% to 2,400 MT, in the first half of 2019 (Chart 6).
In the first half of 2019, tropical veneer imports increased by 1% in France to 36,600 MT, by 6% in Italy to 26,500 MT, by 2% in Greece to 8,200 MT, and by 11% in Romania to 4,500 MT. However, imports fell by 13% in Spain, to 15,700 MT.
Large Chinese suppliers increasingly dominant in UK tropical plywood imports
EU imports of tropical plywood products were 250,100 MT in the first nine months of 2019, 4% more than the same period last year. Import value increased 7% to €221.5 million.
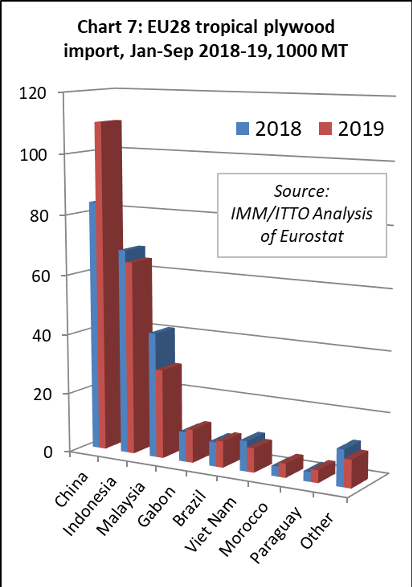
A large and growing proportion of the plywood faced with tropical hardwood imported into the EU is manufactured in China. The EU imported 110,000 MT of this product from China in the first nine months of 2019, 32% more than during the same period in 2018. When linked with news that numerous smaller mills in China have closed in recent years due to new emissions controls, and anecdotal reports from European buyers of a greater focus on quality and species content due to EUTR and CE Marking requirements, the strong implication is that the trade is becoming more concentrated amongst a few large consolidated suppliers in China.
Although direct imports of plywood have increased from a few tropical countries this year, the total volume was down 12% at 122,300 MT in the first nine months of 2019. Imports increased from Gabon by 12% to 11,100 MT, from Brazil by 8% to 8,700 MT, and from Morocco by 41% to 4,600 MT.
However, these gains were not enough offset declining plywood imports from the two largest tropical suppliers, Indonesia and Malaysia, this year. Imports from Indonesia declined 6% to 64,500 MT and fell 29% from Malaysia to 29,700 MT. A brief surge in imports from Viet Nam earlier in the year also faltered in the third quarter so that total imports were down 20% at 8,100 by the end of the nine months to September 2019. (Chart 7).
EU imports of tropical hardwood plywood during 2019 are being strongly influenced by market issues elsewhere in the world, notably the US-China trade dispute which has led to a dramatic decline in Chinese hardwood plywood exports to the United States and increasing diversion of Chinese product to the EU, mainly destined for the UK.
In the first nine months of 2019, UK imports of tropical plywood products increased 19% to 140,300 MT, despite widespread reports of overstocking and declining plywood consumption in the country. UK imports of tropical hardwood plywood from China increased 72% to 78,800 MT in the first nine months of 2019, while UK imports from Malaysia fell 29%, to 25,100 MT, and were down 7% from Indonesia to 26,900 MT.
In contrast to the UK, tropical plywood imports declined into all other major EU markets in the first nine months of 2019, including Belgium (-21% to 26,300 MT), Netherlands (-11% to 24,200 MT), Germany (-7% to 18,600 MT), France (-3% to 14,700 MT) and Italy (-4% to 12,300 MT). A small increase in imports into Greece, by 4% to 2,300 MT, did little to mitigate this downward trend.
Indonesia and Vietnam boost share of EU tropical joinery imports
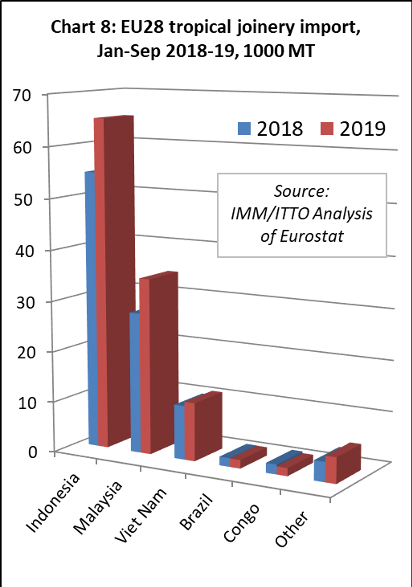
EU imports of tropical joinery products, mainly doors (from Indonesia), and laminated window scantlings and kitchen tops (from Indonesia, Malaysia and Viet Nam), increased 19% to 119,700 MT in the first nine months of 2019. Import value increased 26% to €244.1 million.
EU imports in the first half of 2019 increased from all three of the countries that dominate international trade in tropical joinery products including Indonesia (+19% to 65,100 MT), Malaysia (+25% to 34,700 MT), and Viet Nam (+8% to 11,500 MT) (Chart 8).
In the first half of 2019, imports of tropical joinery products increased by 9% to 48,200 in the UK, by 75% to 37,300 MT in the Netherlands, and by 1% to 14,400 MT in Belgium. There were also significant gains in two smaller markets for tropical joinery products, Ireland increasing 97% to 2,500 MT and Poland up 50% to 1,300 MT. These gains offset a 22% fall in France to 8,100 MT, and a 14% fall in Germany to 5,500 MT.
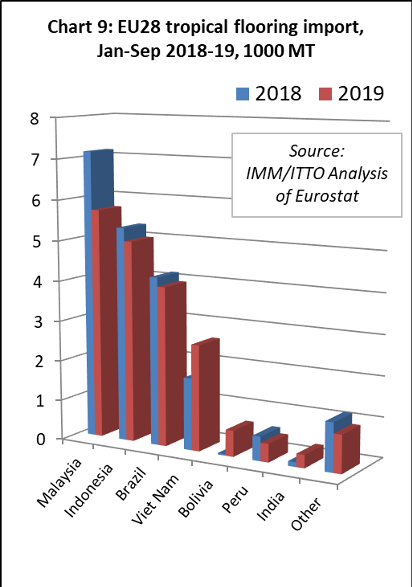
Another fall in EU imports of tropical flooring
EU imports of flooring products from tropical countries fell a further 4% to 19,700 MT in the first nine months of 2018, continuing a long term decline in response to tough competition from European and Chinese manufacturers and non-wood alternatives, fashion trends favouring temperate timbers, supply contraints, and challenges of EUTR conformance. The value of EU imports of wood flooring was more stable, at €45.7 million in the nine month period, only slightly less than €45.8 million in the same period last year.
This year, falling imports from traditionally the leading suppliers – Malaysia (-20% to 5,700 MT), Indonesia (-6% to 5,000 MT), and Brazil (-5% to 4,000 MT) – has been partially offset by rising imports from Viet Nam (+47% to 2,600 MT), Bolivia (from near zero to 600 MT), and India (+187% to 300 MT) (Chart 9).
In the first nine months of 2019, tropical wood flooring imports recovered a bit of ground in France (+25% to 5,400 MT), UK (+54% to 2,200 MT), and the Netherlands (+11% to 1,700 MT). However, imports fell in most other significant European markets including Belgium (-3% to 2,500 MT), Italy (-16% to 1,600 MT), Denmark (-38% to 1,500 MT), Germany (-17% to 1,400 MT), and Spain (-41% to 1,400 MT).
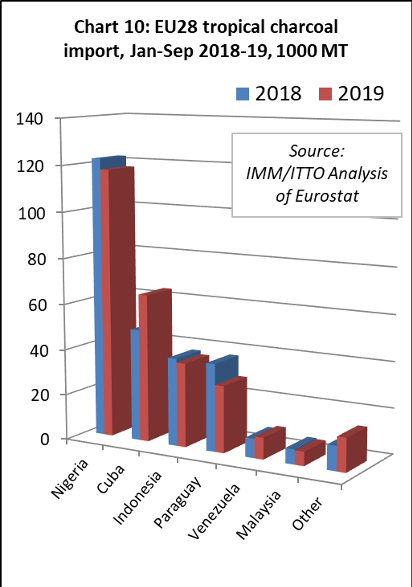
Slowing pace of EU imports of tropical charcoal
EU imports of charcoal from tropical countries have been rising since the start of 2017, although the pace of growth slowed in the third quarter of 2019. Imports of 278,400 MT in the first nine months of 2019 were just 2% more than the same period last year. The value of EU imports of tropical charcoal increased 5% to €111.8 million in the same period.
In the first nine months of 2019, EU imports of charcoal decreased from Nigeria, by 4% to 117,600 MT, from Indonesia by 4% to 36,800 MT, and from Paraguay by 24% to 29,200 MT. However, imports from Cuba increased 32% to 64,600 MT and imports from Venezuela were up 12% at 9,400 MT (Chart 10).
A wide range of EU countries now import wood charcoal from tropical countries. The largest destinations (in descending order in the first nine months of 2019) are: Poland (-10% to 40,900 MT); Greece (+1% to 36,600 MT); Portugal (+33% to 34,800 MT); Spain (+38% to 30,100 MT); Italy (+10% to 28,300 MT); Germany (-42% to 23,400 MT); UK (-3% to 22,400 MT); Netherlands (+74% to 17,500 MT); and Belgium (-38% to 14,900 MT).
PDF of this article:
Copyright ITTO 2020 – All rights reserverd