

EU imports of tropical wood products dipped sharply in 2017 and started this year very slowly but recovered some lost ground in the second and third quarters.
Chart 1 shows twelve monthly rolling total imports (to iron out seasonal fluctuations) into the EU of all tropical wood products listed in HS Chapter 44 (excluding fuelwood, wood waste and chips). It shows that the 12-month rolling total import peaked at 2.17 million metric tonnes (MT) in September 2016, slipped to a low of 1.94 million MT in March, but had recovered to 2.02 million MT by September 2018.
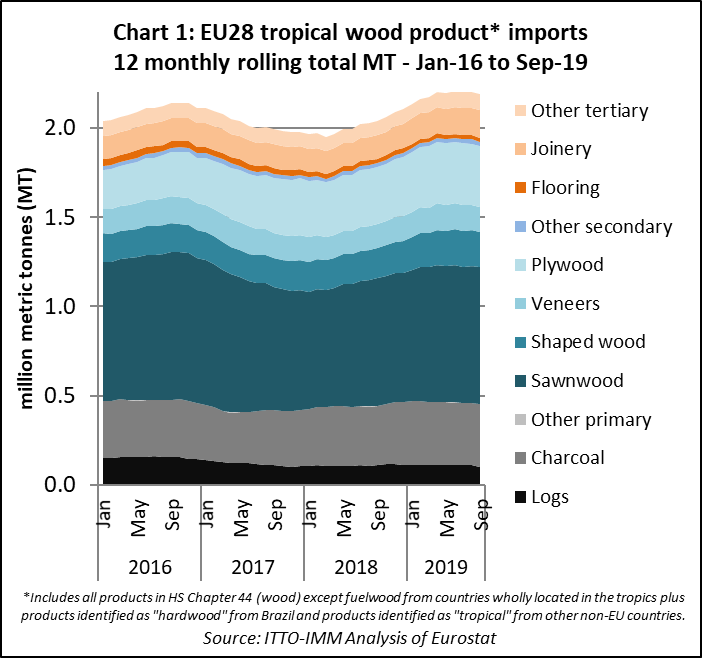
In total, the EU imported 1.58 million MT of tropical wood products in the first nine months of 2018, 3.4% more than the same period in 2017. The total value of EU imports of tropical wood products in the January to September 2018 period was €1.66 billion, 1% more than the same period in 2017.
Although there have been gains in EU imports of tropical sawnwood, charcoal, mouldings, joinery products and logs this year, these have been offset by a decline in imports of tropical plywood, veneers, flooring, and other tertiary products.
9% rise in EU imports of tropical sawnwood
Despite a slow start to the year, EU imports of tropical sawnwood were 539,000 MT in the first nine of 2018, 9% more than the same period in 2017. Import value also increased, by 10% to €545 million. A significant amount of tropical sawnwood arrived into the EU from Cameroon in the third quarter of 2018, taking the total import from that country in the first nine months to 186,500 MT, almost exactly equivalent to the same period in 2017.
Meanwhile tropical sawnwood imports from nearly all other leading suppliers were stronger in the first 9 months of 2018 compared to the same period last year, including from Malaysia (+14% to 81,600 MT), Brazil (+20% to 73,700 MT), Gabon (+19% to 70,800 MT), Congo (+6% to 34,800 MT), Indonesia (+82% to 12,700 MT), Ghana (+8% to 11,000 MT), DRC (+7% to 9,700 MT) and Myanmar (+64% to 6,900 MT). These gains offset declining imports from Côte d’Ivoire (-9% to 21,000 MT) and Suriname (-20% to 4,100 MT). (Chart 2).
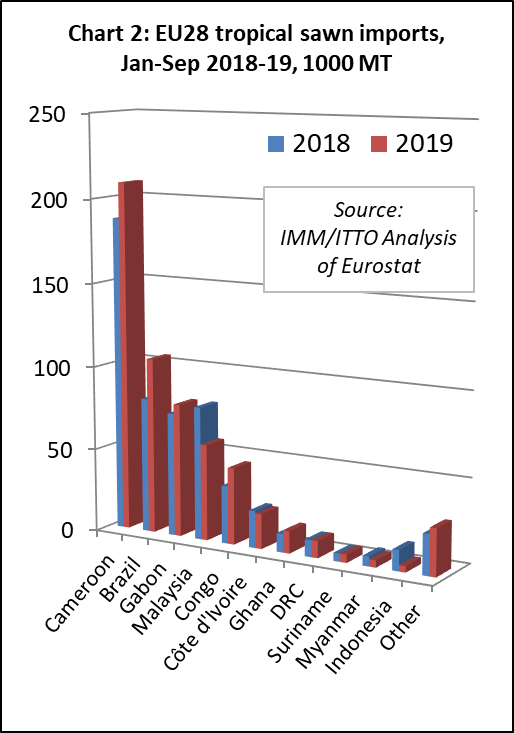
The rise in imports from Indonesia, which only allows exports of S4S lumber, may be partly due to alterations in the HS codes used to record imports from Indonesia following introduction of FLEGT licensing. The rise in EU imports of sawnwood from Indonesia is offset by a similar decline in imports of mouldings from the country.
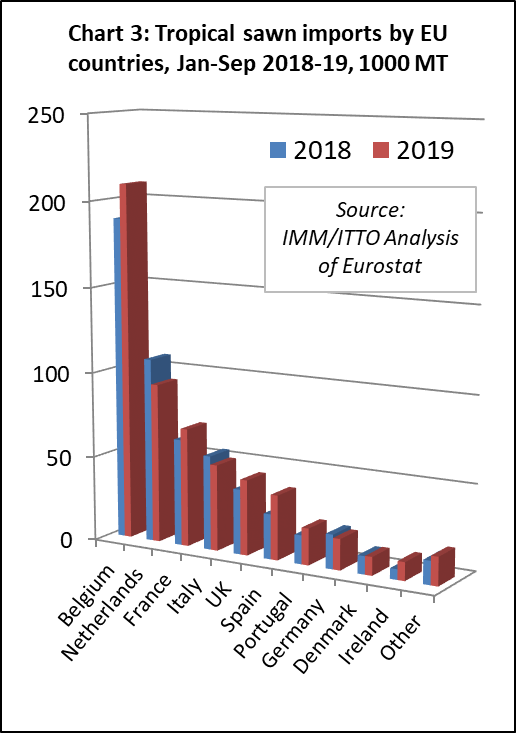
In the first nine months of 2018, tropical sawn hardwood imports increased 8% to 185,000 MT in Belgium, bolstered by strong growth in the third quarter of the year, and also increased in the Netherlands (+14% to 81,600 MT), France (+20% to 73,700 MT), Italy (+19% to 70,800 MT), and Germany (+6% to 22,100 MT). These gains offset a 20% decline to 38,300 MT in the UK, a 15% fall to 25,800 MT in Spain and a 9% decline to 16,300 MT in Portugal (Chart 3).
EU imports of tropical logs pick up pace in third quarter
After a downturn in 2017, the quantity of EU imports of tropical logs recovered ground in the first nine months of 2018. Imports of 86,400 MT during the first months this year were 14% greater than the same period in 2017. The value of tropical logs imported by the EU also increased, by 8% to €43.4 million. As with sawnwood, EU imports of tropical logs picked up pace in the third quarter of 2018 after a relatively slow start to the year.
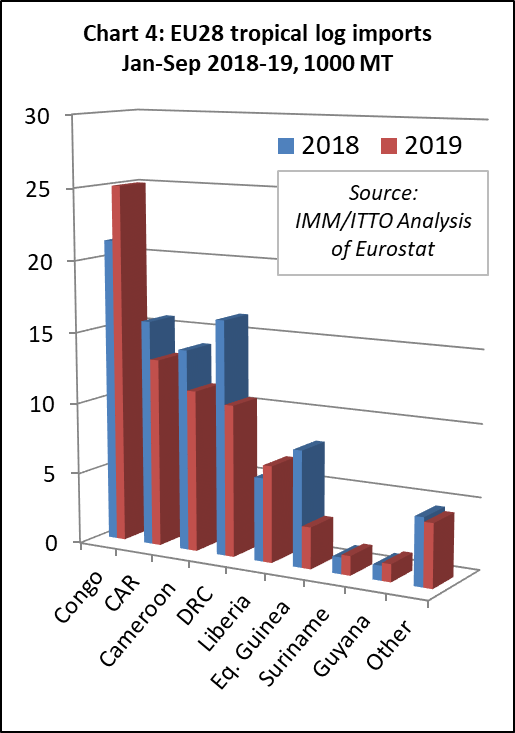
EU imports of tropical logs increased from Congo, the leading supplier, rising 6% to 21,200 MT in the first nine months of 2018. There was also a significant increase in EU log imports from DRC (+37% to 16,300 MT), CAR (+83% to 15,800 MT), Liberia (+69% to 5,500 MT), and Guyana (+90% to 1,200 MT).
These gains offset declining imports from Angola, from around 5,000 MT in the first nine months of 2018 to negligible levels this year. Imports from Equatorial Guinea (5,900 MT) and Suriname (1,200 MT) were at a similar level to last year. (Chart 4).
Most of the gain in EU imports of tropical logs in the first nine months of 2018 was concentrated in France (+24% to 31,200 MT) and Belgium (+33% to 23,200 MT). Imports of tropical logs were slow in Portugal in the first half of 2018 but increased in the third quarter. In total, in the first nine months of 2018, Portugal imported 14,900 MT of tropical logs, 4% more than the same period last year.
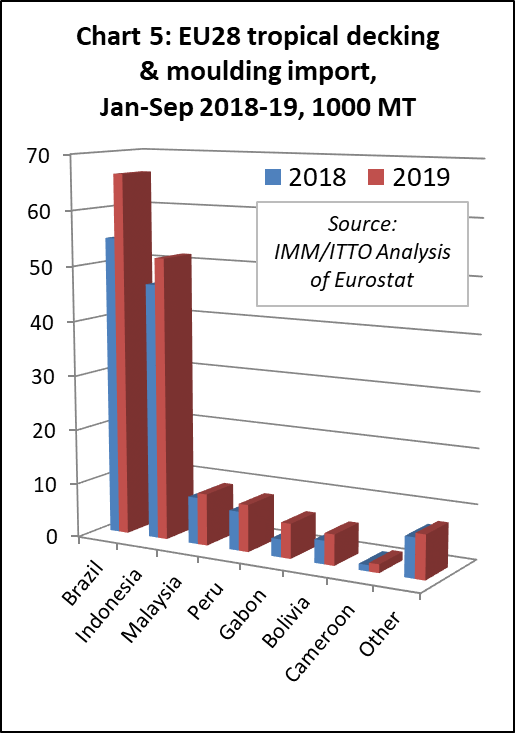
Slight rise in EU tropical decking imports
EU imports of tropical mouldings (which includes both interior mouldings and exterior decking products) increased 5% to 127,400 MT in the first nine months of 2018. Import value increased 8% to €189 million.
A 22% rise in EU imports of mouldings from Brazil to 52,400 MT in the nine month period offset a 15% decline in imports from Indonesia to 46,300 MT. As noted earlier, the latter decline may be partly due to alterations in the HS codes used to record imports from Indonesia since introduction of FLEGT licensing.
EU imports of mouldings increased for some smaller suppliers of this commodity in the first nine months of 2018, including Malaysia (+24% to 8,500 MT), Peru (+52% to 6,700 MT) and Bolivia (+100% to 4,100 MT) (Chart 5).
In the first nine months of 2018, imports of tropical mouldings increased 33% in France to 35,400 MT, 4% in Belgium to 21,000 MT and 10% in Italy to 5,700 MT. These gains were offset by a 11% decline in imports in the Netherlands, to 18,600 MT, and an 18% decline in the UK, to 7,400 MT. Imports were at the same level as the previous year in Germany (28,700 MT) and Denmark (3,100 MT).
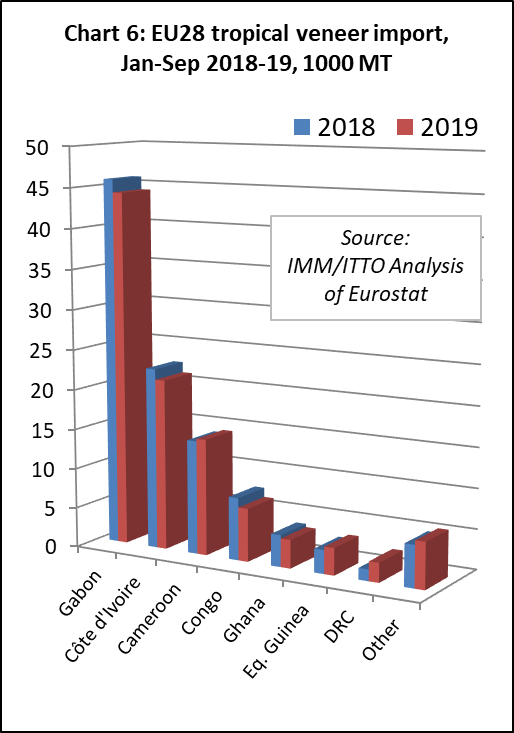
EU imports of tropical veneer down 6%
EU imports of tropical hardwood veneer fell 6% to 103,800 MT in the first 9 months of 2018. Import value fell 17% to €133.1 million. The decline was mainly due to a 17% decrease in imports from Gabon, to 45,600 MT. This decline is likely related to the financial difficulties experienced by Rougier this year. The decline in EU imports from Gabon was partly offset by rising imports from Cote d’Ivoire (+14% to 22,700 MT) and Cameroon (+30% to 14,200 MT). Imports from Congo (7,800 MT) and Ghana (4,000 MT) were unchanged on the previous year (Chart 6).
In the first nine months of 2018, imports of tropical veneer declined in France, the largest EU market, down 9% to 36,100 MT, and were also down 10% to 17,900 MT in Spain, down 25% to 7,800 MT in Greece, and down 14% to 4,000 MT in Germany. Imports in Italy increased 1% to 25,000 MT, having strengthened in the third quarter of 2018.
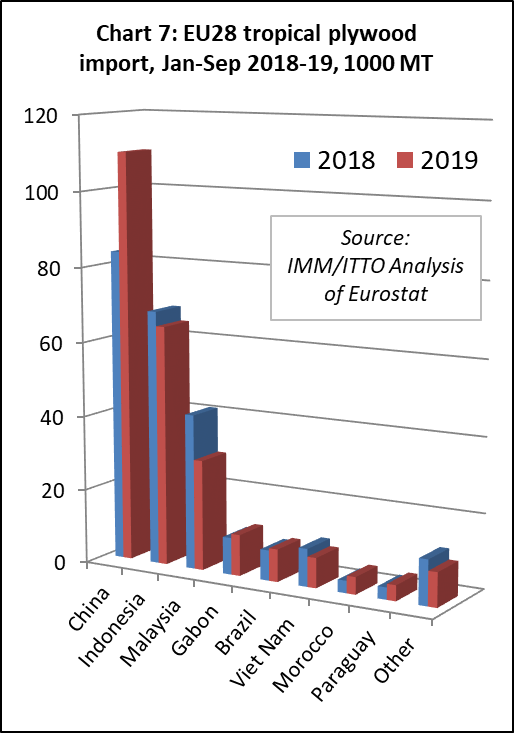
EU direct imports of plywood from the tropics decline 7%
The EU imported 238,100 MT of tropical plywood in the first nine months of 2018, 4% less than the same period in 2017. Import value fell 7% to €206.9 million in the same period.
Direct EU imports of plywood from tropical countries decreased 7% to 144,300 MT in the first nine months of 2018. While imports from Indonesia increased 6% to 68,400 MT, imports from Malaysia fell 17% to 40,500 MT and imports from Gabon fell 28% to 9,900. Although still only a minor supplier, there was a significant 140% increase in EU imports of plywood from Vietnam, to 9,500 MT, in the first nine months of 2018.
The EU imported 83,800 MT of plywood faced with tropical hardwood from China during the first nine months of 2018, unchanged from the same period in 2017. Imports from China this year have been disrupted to some extent by tough new national environmental controls which forced Chinese mills to interrupt production to upgrade or replace emission and waste treatment technology.
The EU also imported 10,100 MT of plywood faced with tropical hardwood from other non-tropical countries in the first nine months of 2018, 5% more than the same period in 2017. Much of the gain was due to a 170% increase in imports from Russia, to 4,200 MT. Imports from Morocco fell 31% to 3,300 MT. (Chart 7).
Imports of tropical plywood in the UK were 117,000 MT in the first nine months of 2018, 2% less than the same period last year. Imports also declined in Belgium (-21% to 33,300 MT), France (-5% to 15,100 MT), Italy (-11% to 12,800 MT) and Denmark (-23% to 2,200 MT). However, these losses were partly offset by rising imports in the Netherlands (+15% to 26,800 MT), Germany (+9% to 19,900 MT), and France (+2% to 10,400 MT).
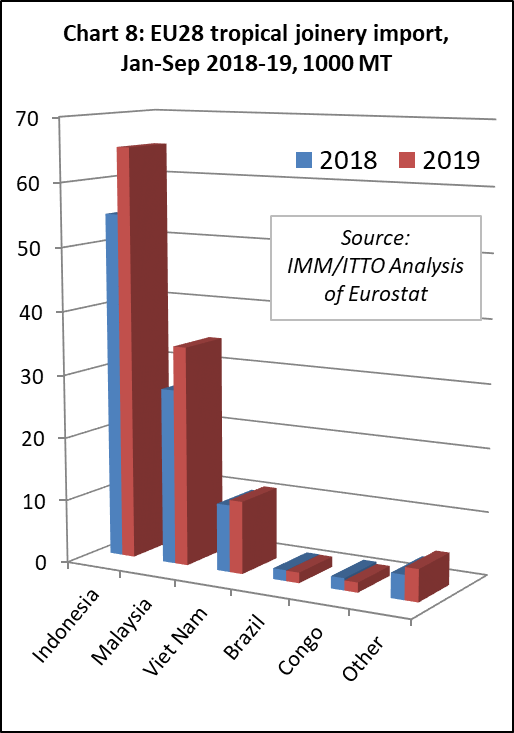
Indonesia and Vietnam boost share of EU tropical joinery imports
EU imports of tropical joinery products (excluding flooring) increased 3% to 103,000 MT in the first nine months of 2018. However, import value decreased by 4% to €195 million. These contrasting trends may imply a shift in the mix of products involved. This category includes a range of products, but mainly doors, laminated kitchen tops, and window scantlings from the tropics.
In quantity terms, imports from Indonesia, by far the EU’s largest tropical supplier of joinery products, increased 6% to 56,400 MT in the first nine months of 2018. There was also a 67% increase in EU imports of joinery products from Vietnam, to 10,600 MT. Imports from Congo increased from negligible levels to 1,900 MT. These gains offset a 14% decline in imports from Malaysia to 27,700 MT. (Chart 8).
Imports of tropical joinery products in the UK, the largest European destination for this product group, increased 13% to 44,500 MT in the first nine months of 2018. Imports increased 26% to 13,800 MT in Belgium and were up 43% to 10,300 MT in France in the same period. However, imports fell 22% to 23,300 MT in the Netherlands and declined 11% to 6,700 MT in Germany.
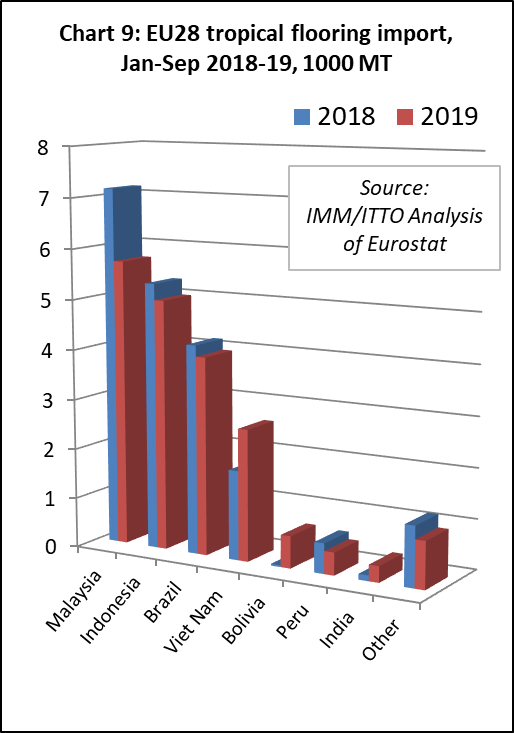
Another fall in EU imports of tropical flooring
EU imports of flooring products from tropical countries fell a further 18% to 20,500 MT in the nine months of 2018, continuing a long term decline in response to tough competition from European and Chinese manufacturers and non-wood alternatives, fashion trends favouring temperate timbers, supply contraints, and challenges of EUTR conformance. The value of EU imports of wood flooring declined 15% to €46.5 million in the first nine months of 2018.
Most of the downturn this year is due to a 37% fall in imports of hardwood flooring products from Brazil, to 4,200 MT in the first nine months of 2018. However imports also fell 6% from Malaysia, to 7,000 MT, 9% from Indonesia to 5,200 MT and 35% from Thailand to just 300 MT. (Chart 9).
In the first nine months of 2018, imports fell dramatically in the two largest EU markets for tropical flooring, declining 42% to 4,300 MT in France and 21% to 2,600 MT in Belgium. However, this decline was partially offset by a 57% increase in imports in Denmark, to 2,400 MT. This year Denmark has overtaken Spain as the third largest EU destination for tropical flooring.
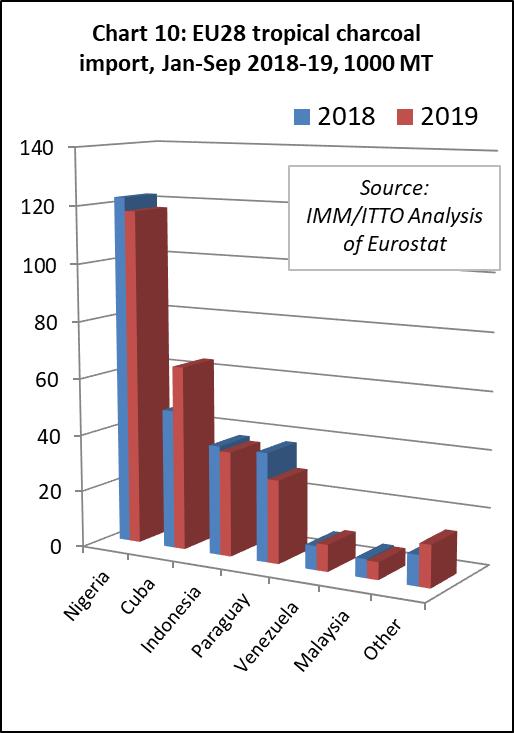
Gradual rise in EU imports of tropical charcoal
EU imports of charcoal from tropical countries have been rising slowly since the start of 2017. Imports of 280,000 MT in the first nine months of 2018 were 5% more than the same period last year. The value of EU imports of tropical charcoal increased 6% to €106.3 million in the same period.
In the first nine months of 2018, EU imports of charcoal from Nigeria increased 15% to 129,000 MT, while imports from Indonesia increased 20% to 38,400 MT. Imports from Venezuela increased from negligible levels to 8,400 MT. These gains offset a 9% decline in imports from Cuba to 48,900 MT and a 13% decline in imports from Paraguay, to 38,200 MT. (Chart 10).
A wide range of EU countries now import wood charcoal from tropical countries. The largest destinations (in descending order this year) are Poland, Germany, Greece, Portugal, Belgium, Italy, UK, and Spain.
In the first nine months of this year, tropical charcoal imports increased in Poland (+36% to 50,200 MT), Greece (+8% to 36,300 MT), Portugal (+23% to 26,000 MT), Belgium (+15% to 26,100 MT), and Italy (+16% to 25,700 MT). However, imports declined 25% to 40,300 MT in Germany, 6% to 21,800 MT in Spain, and 36% to 10,100 MT in the Netherlands. Imports in the UK were stable at 23,200 MT.
PDF of this article:
Copyright ITTO 2020 – All rights reserved